Appearance
CSV Export
Core Feature
This feature is available in all Portrai Explorer deployments.
Export feature data to CSV format for use in external analysis tools, spreadsheets, or archiving.
Accessing CSV Export
CSV export is available from the Explorer sidebar. Each feature column has a download button that provides export options.
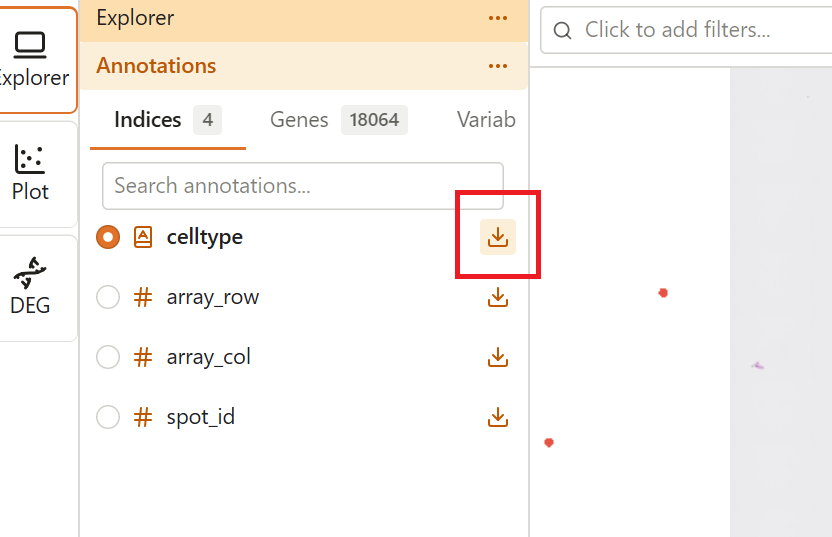
- Open the Explorer extension
- In the Features tab, find the column you want to export
- Click the Download icon (↓) next to the column name
- Select an export option from the dropdown menu
Export Options
When you click the download button, a dropdown menu appears with two options:
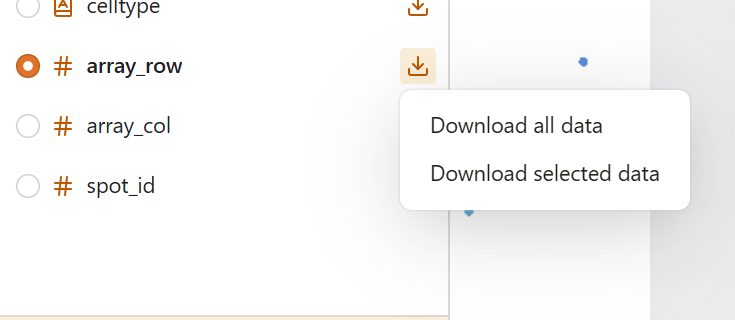
Download All Data
Exports the complete dataset for the selected column, regardless of any active subsets.
Download Selected Data
Exports only the data points that pass your current subset. This option is:
- Enabled when a subset is active
- Disabled (grayed out) when no subset is applied
TIP
Use "Download selected data" to export specific portions of your data after applying subsets or lasso selections.
Supported Column Types
Categorical Columns
Exports category labels for each data point.
Output format:
csv
index,cell_type
AAACCCAAGAAACACT-1,B cell
AAACCCAAGAAACTGT-1,T cell
AAACCCAAGAAAGACA-1,T cell
AAACCCAAGAAAGGCT-1,Macrophage
...
Continuous Columns
Exports numeric values (e.g., gene expression) for each data point.
Output format:
csv
index,CD3E
AAACCCAAGAAACACT-1,0.0
AAACCCAAGAAACTGT-1,2.345
AAACCCAAGAAAGACA-1,1.892
AAACCCAAGAAAGGCT-1,0.0
...
Embedding Columns
Exports X and Y coordinates from projection data (e.g., UMAP, t-SNE, spatial coordinates).
Output format:
csv
index,UMAP x,UMAP y
AAACCCAAGAAACACT-1,1.234,5.678
AAACCCAAGAAACTGT-1,2.345,6.789
AAACCCAAGAAAGACA-1,-0.123,4.567
...
File Details
File Naming
Exported files are automatically named based on the column:
{column_name}.csv
Examples:
cell_type.csvCD3E.csvUMAP.csv
Index Column
The first column (index) contains:
- Cell/observation IDs if an ID column is configured in the dataset
- Numeric indices (0, 1, 2, ...) if no ID column is available
Encoding
- UTF-8 encoding
- Standard CSV comma delimiters
- Values containing commas, quotes, or newlines are properly escaped
Working with Exported Data
In Excel
- Double-click the CSV file to open directly, or
- Use Data > From Text/CSV for more import options
- Verify columns are detected correctly
In R
r
data <- read.csv("cell_type.csv")
head(data)
In Python
python
import pandas as pd
data = pd.read_csv("cell_type.csv")
data.head()
Large Dataset Handling
CSV export uses streaming technology to handle large datasets efficiently:
- Files download progressively as they are generated
- No file size limit imposed by the browser
- Memory-efficient for datasets with millions of points
WARNING
For very large exports, ensure you have sufficient disk space and a stable internet connection.
Plot Data CSV Export
In addition to the per-column export above, every plot in the Plot extension can export the underlying row-level data it visualizes as CSV. This is available for all six plot types: Scatter, Bar, Stacked Bar, Violin, Box, and Dot.
Accessing Plot CSV Export
- Open the Plot extension and configure a plot
- Click the Export button (download icon) in the plot toolbar
- Under Export data as CSV, choose an option:
- Download All Data - export every row
- Download Selected Data - export only the rows in the current visibility selection (enabled when a selection is active)
What's Included
The export contains one row per data point, with an index column (cell/observation ID, or the row index when no ID is configured) followed by the columns the plot actually uses:
| Plot type | Exported columns |
|---|---|
| Scatter | The X and Y axis sources (continuous columns or signature scores) |
| Bar | The Group By column, plus the aggregated variable (unless the aggregation is a simple count) |
| Stacked Bar | The Group By column and the Stack By column |
| Violin | The Group By column and each selected variable |
| Box | The Group By column and each selected variable |
| Dot | The Group By column and each selected variable |
Plot CSV export becomes available only once the plot's required fields are configured — for example, a Group By column and at least one variable for Violin, Box, and Dot plots.
Categorical columns are written as their human-readable labels (matching the Explorer per-column export), and numeric columns (continuous features or signature scores) are written as raw values. The same UTF-8 encoding, comma escaping, and streaming behavior described above apply.
DEG Analysis Results Export
InSilicoLab Feature
DEG result export is exclusive to Portrai InSilicoLab.
Differential expression analysis results can be exported from the DEG Analysis workspace. See DEG Analysis - Data Table CSV Export for details.
Troubleshooting
Download Button Not Responding
- Ensure the feature data is fully loaded (no loading spinner)
- Try refreshing the page
"Download Selected Data" is Disabled
- This option requires an active subset
- Apply a subset or lasso selection first
File Contains Fewer Rows Than Expected
- Check if "Download selected data" was used instead of "Download all data"
- Verify your subset settings
Download Interrupted
- Check your internet connection
- Ensure sufficient disk space
- Try downloading again
Related Topics
- Image Export - Export visualizations as PNG images
- Features - Understanding feature types
- Subset - Subset data before export
- DEG Analysis - DEG results CSV export