Appearance
Layer Settings
Core Feature
This feature is available in all Portrai Explorer deployments.
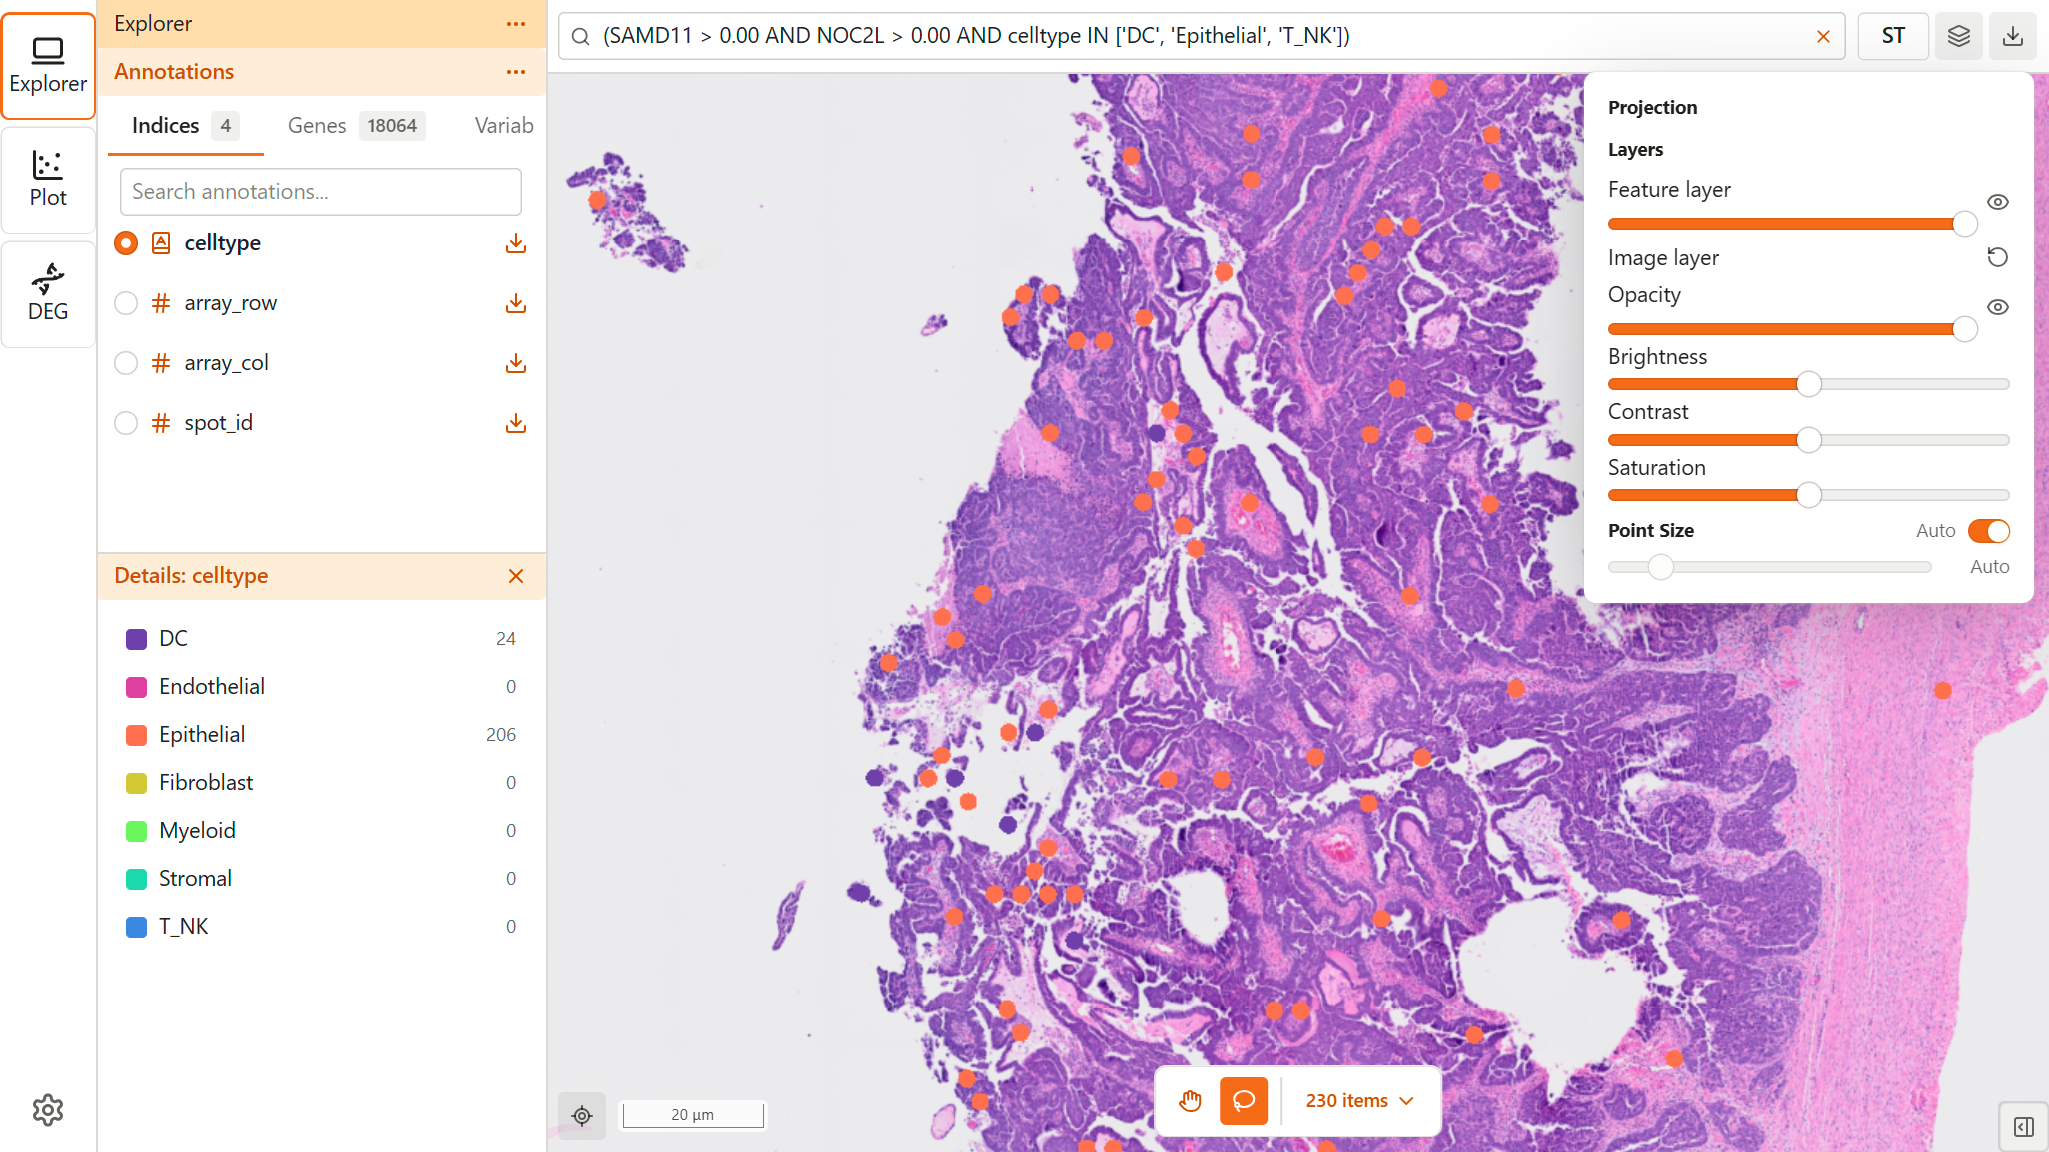
Layer Settings control the appearance of data points and background images in the map viewer. Access these settings through the Layers button (layer icon) in the map viewer toolbar.
Accessing Layer Settings
- Click the Layers button (layer icon) in the map viewer toolbar
- A popover panel opens with all layer controls
- Changes apply immediately to the view
Projection Mode
At the top of the toolbar, select the coordinate system for displaying your data:
- For 2 or fewer projection modes: Segmented control buttons
- For 3 or more projection modes: Dropdown selector
Available projections depend on your project data (e.g., Spatial, UMAP, t-SNE, PCA).
Points
Controls for data point appearance, combining opacity and size settings.
Opacity
| Control | Description |
|---|---|
| Opacity slider | 0 (transparent) to 1 (opaque) |
| Eye toggle | Quick show/hide toggle |
Default: 0.8
Point Size
| Control | Description |
|---|---|
| Auto toggle | Enable automatic point sizing |
| Size slider | Manual size from 1px to 15px |
Defaults:
- Auto: Enabled (points scale with zoom level)
- Size: 3px (when Auto is disabled)
When Auto is enabled, points automatically scale based on zoom level. Manually adjusting the size slider will automatically disable Auto mode.
Image
Multi-Image Mode
TIP
Multi-image mode activates automatically when the project contains multiple raster images (e.g., DAPI + Cell Boundary, or H&E + fluorescence channels).
When multiple images are detected, each image channel is listed with independent controls:
| Control | Description |
|---|---|
| Toggle all (header) | Show/hide all image layers at once (eye icon in section header) |
| Channel Color | Pseudocolor selection (Blue, Green, Red, Cyan, Magenta, etc.) |
| Contrast Limits | Min/Max range slider for contrast stretch |
| Opacity | Per-channel opacity (0 to 1) |
| Eye toggle | Per-channel show/hide |
| Reset button | Restore channel to default settings |
Each channel is automatically assigned a distinct default color (Blue, Green, Red, etc.) for easy visual differentiation.
How Fluorescence Channels are Composited
Fluorescence channels use additive blending, the industry standard for microscopy:
- Each channel's pseudocolored values are summed together
- Where channels overlap, colors combine naturally (e.g., Blue + Green = Cyan)
- Pixels with zero signal are transparent, allowing layers below to show through
- This is scientifically accurate — fluorescence signals represent emitted photons that physically add together
H&E + Fluorescence Overlay
When both H&E (brightfield) and fluorescence images are present:
- H&E renders as the base layer with standard RGB
- Fluorescence channels overlay on top with additive blending
- Areas with no fluorescence signal are transparent, revealing the H&E tissue image underneath
- H&E and fluorescence channels have independent controls
Contrast Limits (Min/Max)
The contrast limits slider uses two handles to set the display range:
- Min (left handle): Pixel values at or below this become black/transparent. Raise this to remove background noise.
- Max (right handle): Pixel values at or above this become full brightness. Lower this to brighten dim signals.
Formula: display = clamp((pixel - min) / (max - min), 0, 1)
Default: Auto-detected from image data. Portrai Explorer reads the lowest-resolution overview and computes the 0.05th/99.95th percentile of non-zero pixel values to determine optimal initial contrast limits.
Single-Image Mode
When only one image is available, the standard image layer controls are shown:
| Control | Range | Default | Description |
|---|---|---|---|
| Opacity | 0 to 1 | 1 | Image transparency |
| Brightness | -1 to 1 | 0 | Lighten or darken the image |
| Contrast | -1 to 1 | 0 | Adjust light/dark differences |
| Saturation | -1 to 1 | 0 | Adjust color intensity |
Additional controls for single-band (grayscale) images:
| Control | Range | Default | Description |
|---|---|---|---|
| Contrast Limits | 0 to 65535 | Auto-detected | Min/Max range for contrast stretch |
| Channel Color | Select | Grayscale | Pseudocolor for visualization |
Automatic Detection
Portrai Explorer automatically detects single-band (grayscale) vs multi-band images from the GeoTIFF file, and computes optimal contrast limits from the actual pixel data for fluorescence channels.
Background Color
- Fluorescence-only mode (no H&E image): The background is black, matching the standard fluorescence microscopy convention.
- H&E present or single-image mode: The background is white. When exporting as PNG, the background is always white for non-fluorescence modes.
Tips for Effective Settings
Dense Data
For datasets with many overlapping points:
- Lower point opacity - See through overlapping points
- Disable Auto, use smaller point size - Reduce overlap
- Lower image opacity - Reduce visual noise
Fluorescence Imaging
For multi-channel fluorescence data:
- Adjust contrast limits per channel - Raise min to remove background noise
- Choose distinct colors - Avoid overlapping color channels
- Toggle channels - Hide channels to isolate specific signals, or use the header eye icon to toggle all at once
Presentation
For figures and screenshots:
- Full opacity on points - Clear, distinct colors
- Appropriate point size - Visible but not overwhelming
- Tune contrast limits - Professional appearance
Troubleshooting
Points Not Visible
- Check point opacity is not 0
- Increase point size or disable Auto
- Verify data is loaded (check point count in toolbar)
Background Image Not Showing
- Check image opacity is not 0
- Verify projection mode has a raster layer (e.g., Spatial view)
- Click the eye toggle to show the layer
Fluorescence Image Too Dark
- Contrast limits are auto-detected, but may need fine-tuning for specific datasets
- Lower the Max value in the contrast limits slider
- Raise the Min value to remove background noise and increase contrast
- Use the Reset button to restore auto-detected defaults
Channel Colors Look Wrong
- Each channel is assigned a default color automatically
- Change colors via the Channel Color selector in each channel's controls
- Reset button restores the default color assignment
Related Topics
- Map Viewer - Map viewer overview
- Image Adjustments - Detailed image adjustment reference
- Color Mapping - Point coloring based on features
- Navigation - Zoom and pan controls