Appearance
Color Mapping
Core Feature
This feature is available in all Portrai Explorer deployments.
Color mapping assigns colors to data points based on feature values, allowing you to visualize patterns and distributions in your spatial transcriptomics data.
Selecting a Color Basis
From the Feature List
- Open the Explorer extension
- In the Sidebar, browse the Features list
- Click on a feature name to apply it as the color mapping
- The map updates immediately with the new coloring
Feature Type Tabs
Switch between feature types to find the coloring you need:
| Tab | Use For |
|---|---|
| Categorical | Cell types, clusters, discrete groups |
| Continuous | Gene expression, numeric scores |
Categorical Color Mapping
When you select a categorical feature, each category receives a distinct color.
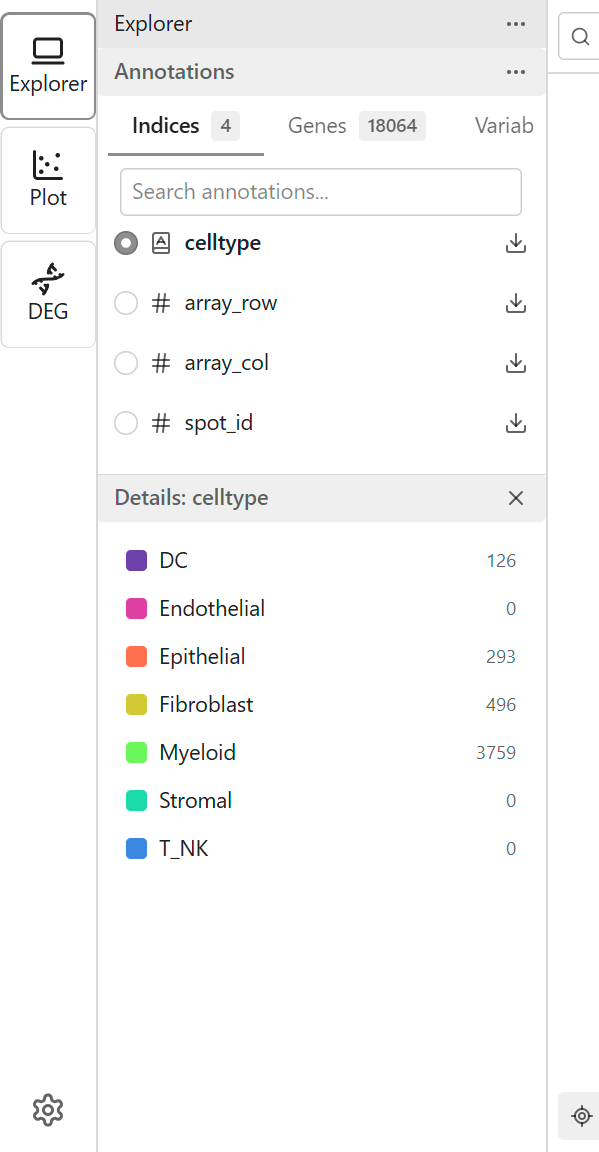
Legend
The legend displays:
- Category names
- Assigned colors
- Optionally, point counts per category
Interacting with Categories
- Hover over legend items to highlight that category on the map
Customizing Category Colors
You can customize the color assigned to any category to better distinguish groups or match your publication standards.
How to Change a Category Color
- Click the color box next to any category in the Detail Panel
- A color picker popover appears with three selection methods:
| Method | Description |
|---|---|
| Preset Palette | Choose from 20 curated colors designed for data visualization |
| HEX Input | Enter a specific HEX color code (e.g., #FF5733) |
| Native Picker | Click the color swatch to open your system's color picker |
- Select a color - the map updates immediately
- Click outside the popover to close it
Identifying Custom Colors
Categories with custom colors display a highlighted border around their color box, making it easy to see which colors have been modified from the default colormap.
Resetting Colors
- Click the Reset button in the color picker to restore the category to its default colormap color
- This removes the custom color and re-applies the global categorical colormap
Color Persistence
Custom category colors are saved to your browser's local storage:
- Colors persist across sessions
- Colors are specific to each feature (changing colors for "cell_type" doesn't affect "cluster")
- Clearing browser data resets all custom colors
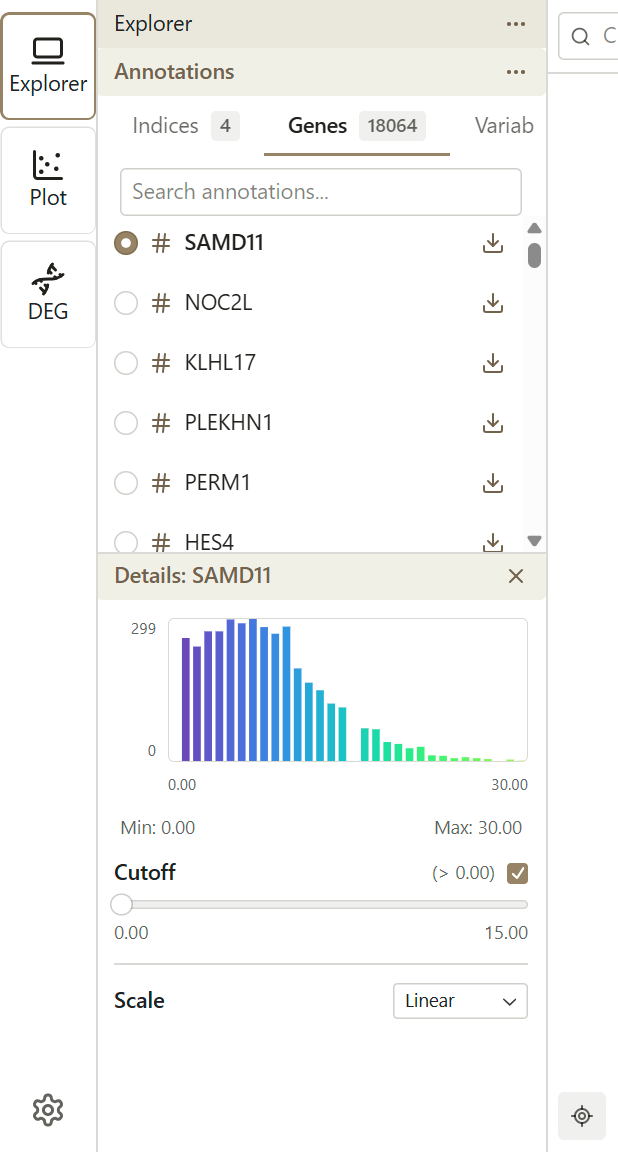
Continuous Color Mapping
When you select a continuous feature, values are mapped to a color gradient.
Color Gradient
The default gradient maps:
- Low values → One end of the color scale
- High values → Other end of the color scale
Legend
The legend displays:
- Color gradient bar
- Minimum value
- Maximum value
- Current range settings
Adjusting Color Range
For continuous features, you can adjust the min/max range to emphasize specific value ranges.
Why Adjust Range?
- Highlight differences - Narrow the range to see subtle variations
- Handle outliers - Exclude extreme values that compress the color scale
- Focus on relevant values - Set range to biologically meaningful thresholds
Cutoff Adjustment
Use the cutoff slider to exclude low values from the color mapping:
- Adjust the cutoff percentage (0-50%) to filter out low-expressing cells
- Useful for highlighting cells with significant expression
- Applied before the color scale transformation
Colormap Selection
Portrai Explorer provides separate colormaps for continuous and categorical features.
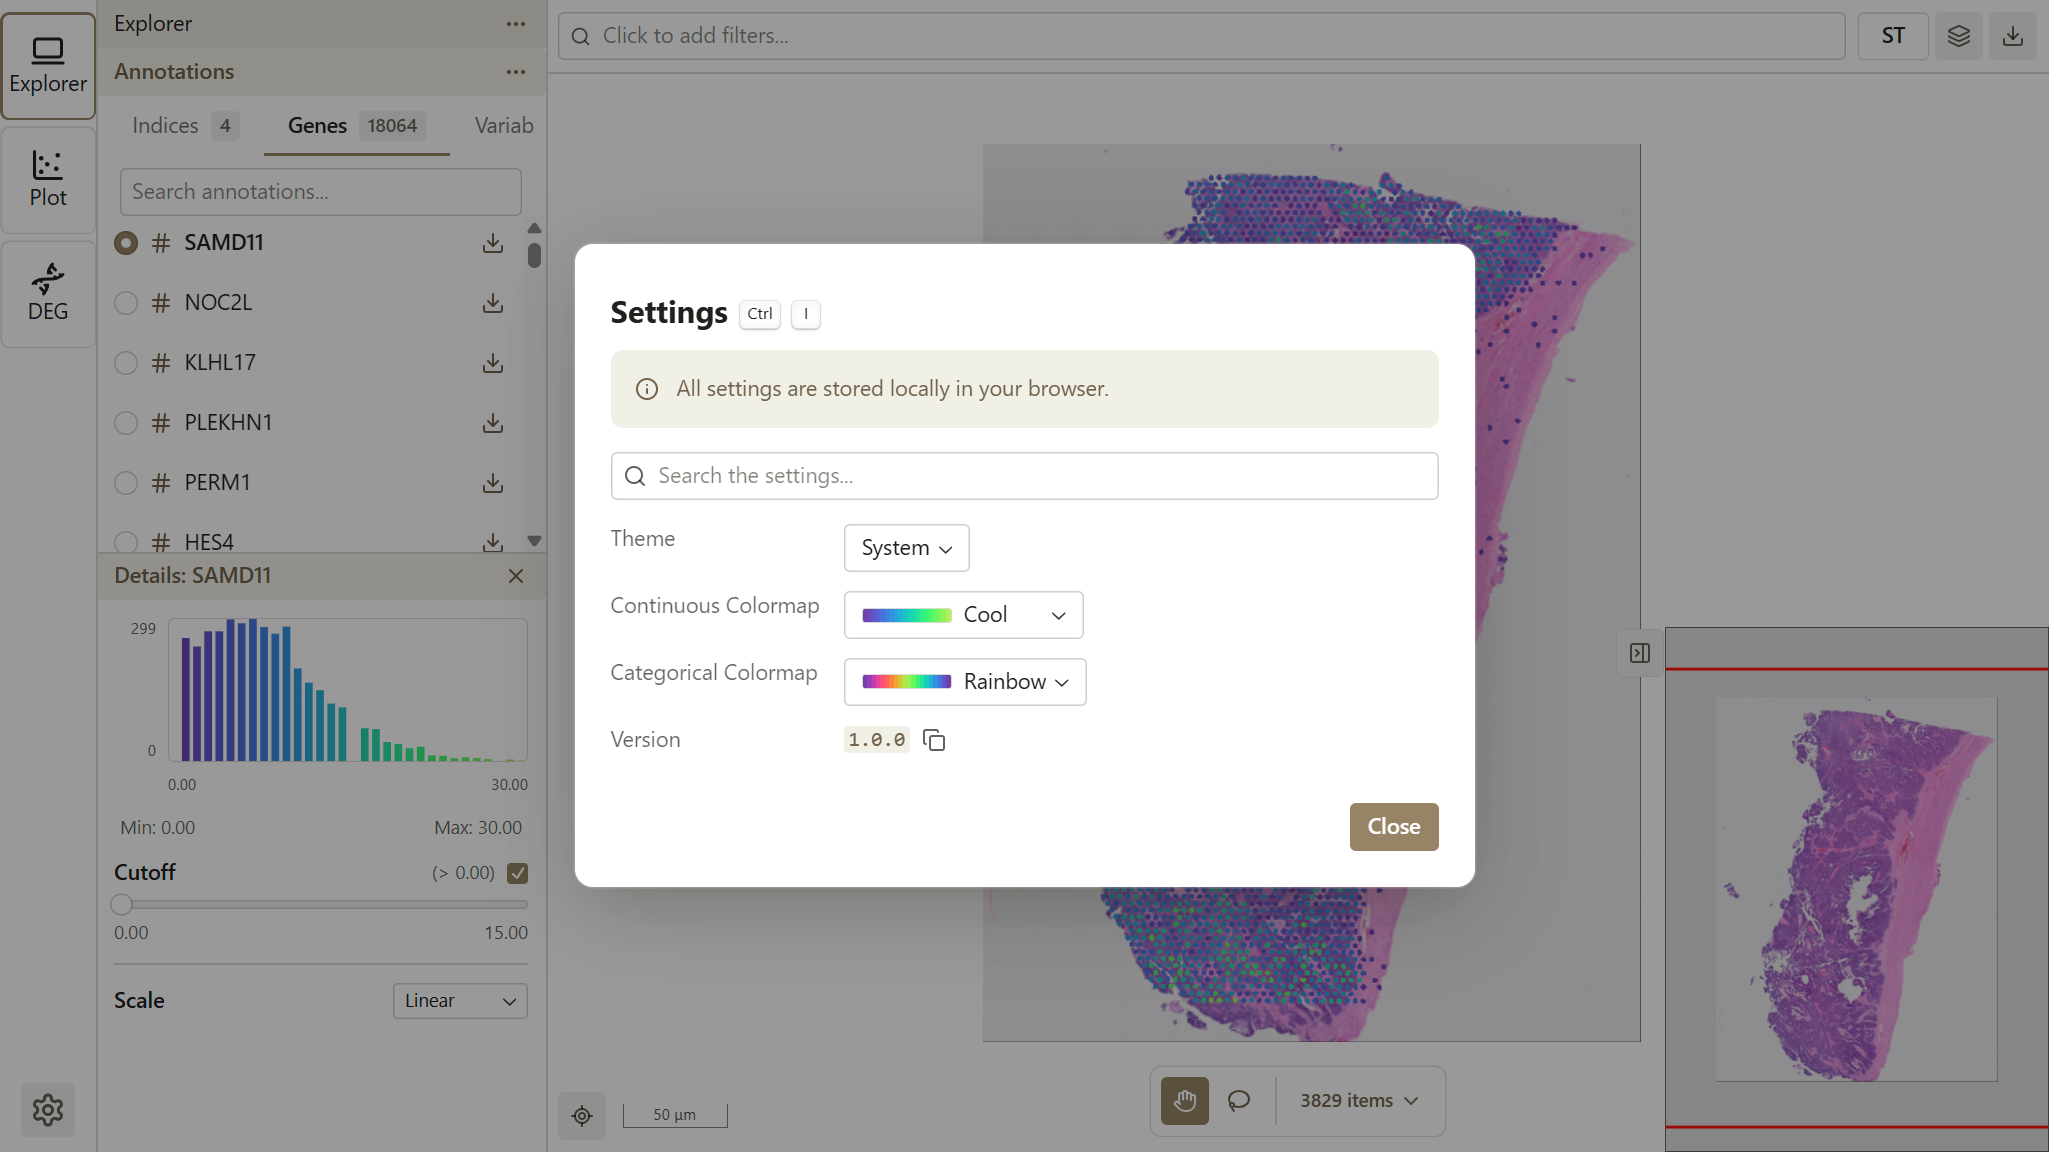
Global Colormap Settings
The default colormaps are configured in Settings (accessible via the gear icon in the Activity Bar). Changes to the global colormap affect all visualizations throughout the application.
See Preferences for detailed configuration options.
Available Colormaps
Continuous Colormaps
Sequential - Best for expression data:
| Colormap | Best For |
|---|---|
| Cool | General expression (default) |
| Viridis | Perceptually uniform |
| Inferno | High contrast, dark theme |
| Plasma | Vivid color range |
| Magma | Subtle gradients |
| Cividis | Color blindness friendly |
| Turbo | High contrast rainbow |
| Blues/Greens/Reds/Purples | Single-hue emphasis |
Diverging - Best for data with a center point:
| Colormap | Best For |
|---|---|
| Red-Blue | Fold change visualization |
| Red-Yellow-Green | Three-way comparison |
| Red-Yellow-Blue | Temperature-like scale |
| Brown-Blue-Green | Earth tones |
| Pink-Yellow-Green | Soft diverging |
| Spectral | Multi-color diverging |
Categorical Colormaps
| Colormap | Best For |
|---|---|
| Rainbow | Many categories (default) |
| Sinebow | Smooth color transitions |
| Turbo | High contrast distinct colors |
Choosing a Colormap
Consider:
- Feature type - Use continuous colormaps for numeric values, categorical for discrete groups
- Accessibility - Viridis and Cividis work better for color blindness
- Contrast - Dark background may need different colors than light
- Consistency - Use global settings for uniform appearance across views
Signature Coloring
Color by computed signature scores instead of individual features.
How to Use
Create a signature with genes of interest
Select the signature for coloring
Choose a combination method:
Method Use Case Max Highlight cells expressing any gene highly Min Find cells expressing all genes Sum Total expression across gene set Avg Average expression level UMI Count Normalized expression The map colors by the computed score
Scale Types
For continuous data, different scale types affect how values map to colors.
| Scale | Description | Use When |
|---|---|---|
| Linear | Direct mapping | Most cases (default) |
| Log | Natural logarithm | Wide value ranges (requires min ≥ 0) |
| Log2 | Base-2 logarithm | Wide value ranges (requires min ≥ 0) |
| Log1p | log(x+1) transformation | Single-cell RNA-seq data |
| SymLog | Symmetric log | Data with zero or negative values |
| Sqrt | Square root mapping | Moderate compression |
| Power | Squared mapping | Emphasize small values |
Changing Scale Type
- Look for the scale selector in color settings
- Choose the appropriate scale
- The coloring updates to reflect the new scale
TIP
Log and Log2 scales are disabled when the minimum value is negative. Use SymLog or Log1p for data that includes zero or negative values.
Tips for Effective Coloring
For Cell Type Analysis
- Use categorical coloring with cell type features
- Check that colors are distinguishable
- Use legend hover to verify identifications
For Gene Expression
- Start with linear scale
- Adjust range to focus on expressing cells
- Try log scale if expression varies widely
- Compare multiple genes by switching quickly
For Finding Patterns
- Try different colormaps to see patterns
- Adjust range to maximize contrast
- Combine with spatial/embedding views
- Use subsets to reduce noise
Troubleshooting
All Points Same Color
- Check if feature has variation
- Adjust the color range
- Verify data is loaded correctly
Colors Too Similar
- Try a different colormap
- Narrow the color range
- Use log scale for compressed ranges
Legend Not Showing
- Ensure a feature is selected
- Check if legend is collapsed or hidden
- Resize the workspace if needed
Related Topics
- Features - Browse available features
- Signatures - Create gene groups
- Layer Settings - Adjust point appearance
- Image Adjustments - Modify background image