Appearance
Interface Overview
Core Feature
This feature is available in all Portrai Explorer deployments.
Portrai Explorer uses a three-pane layout designed for efficient data exploration. This page explains each component and how they work together.
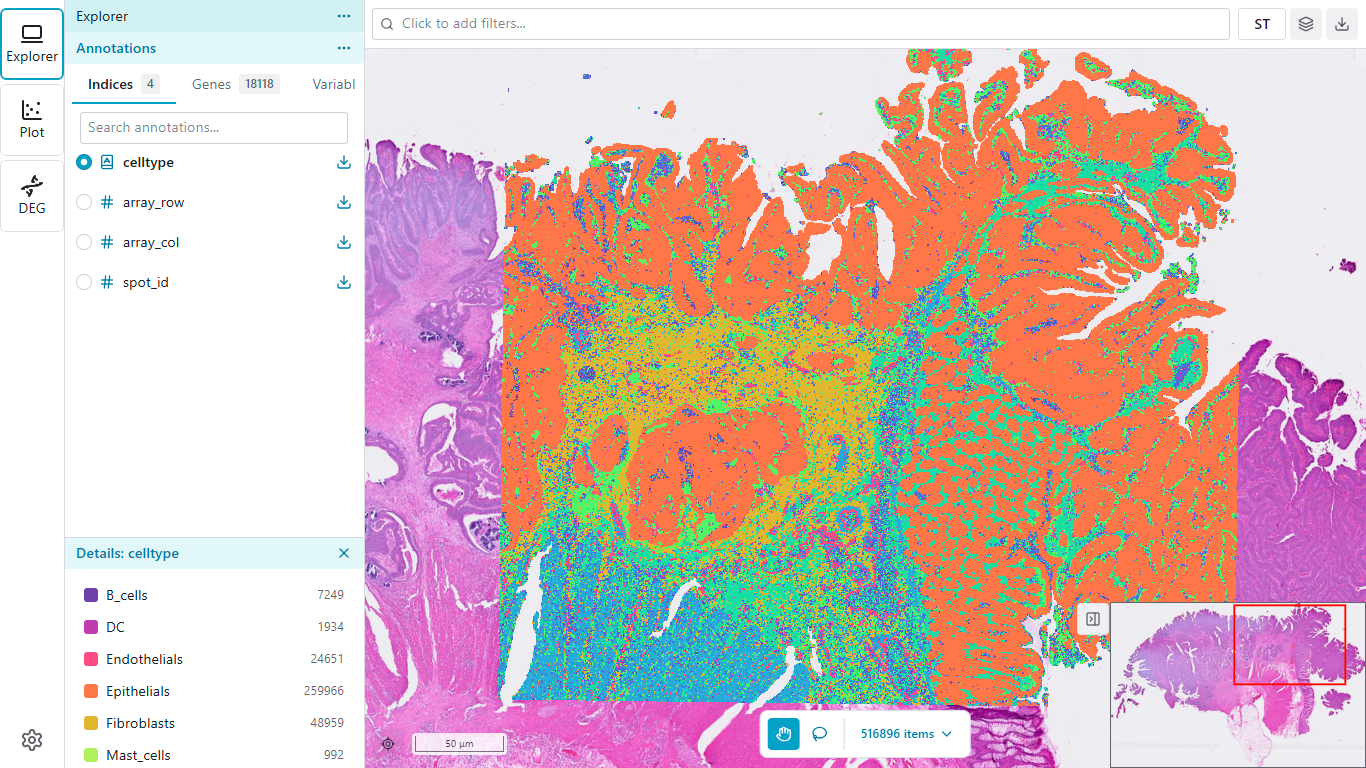
Layout Structure
The interface consists of three main areas:
┌──────────────────────────────────────────────────────────┐
│  Activity   │    Sidebar          │    Workspace         │
│    Bar      │                     │                      │
│             │  Controls and       │   Main visualization │
│  [Explorer] │  settings for the   │   area (map viewer   │
│  [Plot]     │  active extension   │   or scatter plot)   │
│  [...]      │                     │                      │
│  [Settings] │                     │                      │
└──────────────────────────────────────────────────────────┘
Explorer and Plot are the core extensions available in all deployments. Additional extensions (such as DEG Analysis in InSilicoLab) may appear in the Activity Bar depending on your deployment.
Activity Bar
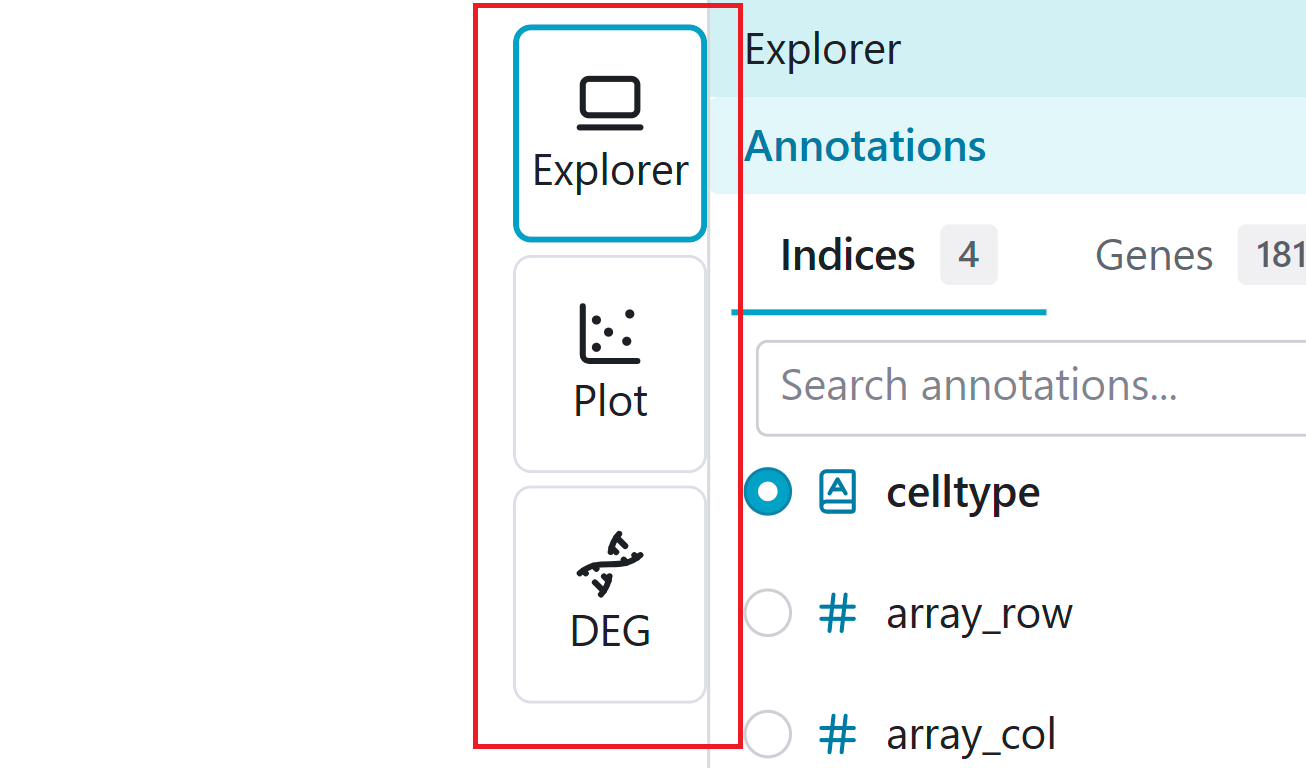
The Activity Bar is located on the left edge of the screen. It provides quick access to different extension modules and application settings. In Compact Mode, the Activity Bar also displays panel buttons for quick access to sidebar content.
Extensions
| Icon | Extension | Description |
|---|---|---|
| Map icon | Explorer | Spatial data visualization and feature management |
| Chart icon | Plot | Scatter plots and analytical visualizations |
Click an extension icon to switch between modules. The Sidebar and Workspace will update to show controls and content for the selected extension.
Notifications
Click the bell icon at the bottom of the Activity Bar to view notifications.
| Element | Description |
|---|---|
| Bell icon | Opens the notification panel |
| Red badge | Shows the count of unread notifications (up to 99+) |
The notification panel displays:
- Notification cards with type icon, title, message, and relative timestamp
- Action buttons on actionable notifications (e.g., "View Results")
- Dismiss (X) button on each notification
- Clear all button in the panel header
Notifications automatically appear when important events occur, such as:
- DEG analysis completion (InSilicoLab)
- Session expiry warnings (InSilicoLab)
TIP
The notification panel opens automatically when new notifications arrive and closes after 5 seconds. All notifications are marked as read when you open the panel.
Settings
Click the gear icon at the bottom of the Activity Bar to access application settings:
- Theme - Switch between Light, Dark, or System theme
- App Color - Customize the application accent color
- Version - View application version information
Sidebar
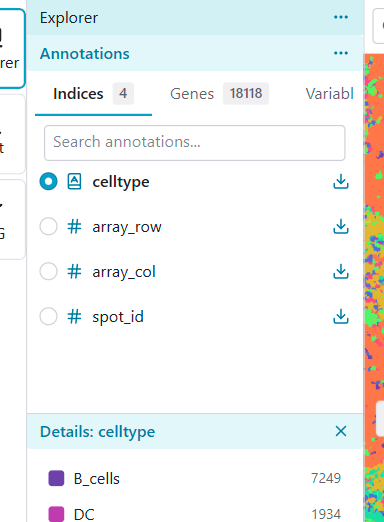
The Sidebar displays controls and settings for the currently active extension. Its contents change depending on which extension is selected.
Explorer Sidebar
When the Explorer extension is active, the Sidebar contains:
- Features Tab - Browse and select features for color mapping
- Categorical features (cell types, clusters)
- Continuous features (gene expression)
- Embedding coordinates (UMAP, t-SNE)
- Signatures Tab - Create and manage custom gene groups
- Search - Search the feature list by name
- Detail Panel - Always visible panel showing statistics for the selected feature (category counts for categorical, value range for continuous)
Plot Sidebar
When the Plot extension is active, the Sidebar contains:
- Plot Type - Select visualization type (Scatter Plot)
- Axis Settings - Configure X and Y axes
- Color Settings - Set color mapping options
- Display Options - Adjust point size and other visual settings
- Details Panel - View details of the currently selected color-by feature or Signature
Resizing
You can resize the Sidebar by dragging its right edge. This is useful when you need more space for the Workspace or want to see longer feature names.
Compact Mode
Compact Mode minimizes the Sidebar to maximize workspace area while maintaining quick access to sidebar content.
Entering Compact Mode
Drag the Sidebar's right edge to the left until it collapses (below approximately 100 pixels). The Sidebar transforms into an Activity Bar-integrated panel system.
Using Compact Mode
In Compact Mode, panel buttons appear in the Activity Bar below the extension icons:
| Action | Result |
|---|---|
| Hover over a panel button | Preview the panel as a popover |
| Click a panel button | Pin the panel open as a popover |
| Click outside the popover | Close the pinned panel |
Exiting Compact Mode
Drag the collapsed Sidebar's edge to the right to expand it back to the normal layout. Your previous Sidebar width is restored.
TIP
Compact Mode is ideal for presentations or when you need the maximum visualization area. Your Sidebar width preference persists across sessions.
Workspace
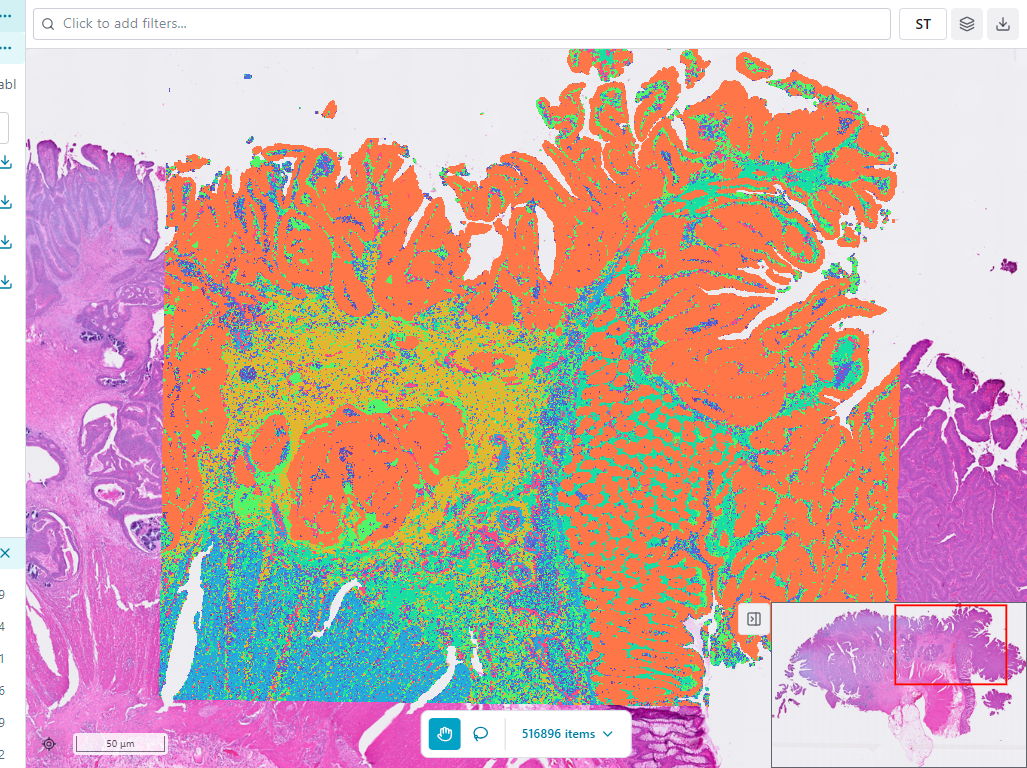
The Workspace is the main visualization area. It displays either the map viewer (Explorer) or scatter plots (Plot) depending on the active extension.
Explorer Workspace
The Explorer workspace shows the map viewer with:
- Map View - Interactive visualization of spatial data
- Toolbar - Mode selection (Pan/Selection), zoom controls
- Legend - Color scale reference for the current color mapping
- Subset Panel - Access to subsetting controls and saved subsets
Plot Workspace
The Plot workspace displays:
- Scatter Plot - Interactive plot based on your axis configuration
- Legend - Color scale or category reference
- Selection Tools - Lasso selection for plot-based subsetting
Navigation Between Views
Switching Extensions
- Click an extension icon in the Activity Bar
- The Sidebar and Workspace update immediately
- Your selections and subsets persist when switching back
Projection Modes
Within the Explorer extension, you can switch between different projection modes. Available projections depend on your project data. Common examples include:
- Spatial - Original tissue coordinates
- UMAP - UMAP dimensionality reduction
- t-SNE - t-SNE dimensionality reduction
- PCA - Principal component analysis
The projection mode selector is located in the Explorer toolbar. Your project may include additional or different projections based on the analysis performed during data preparation.
Keyboard Shortcuts
Portrai Explorer supports keyboard shortcuts for common actions:
| Shortcut | Action |
|---|---|
| 1, 2, 3... | Switch to extension by number (1 = Explorer, 2 = Plot, etc.) |
| Ctrl/Cmd + \ | Toggle Compact Mode |
| Ctrl/Cmd + I | Open Settings |
| L | Open Layer Settings (in Map Viewer or Scatter Plot) |
| Space (hold) | Temporarily switch to Pan mode while in Selection mode |
TIP
On macOS, use Cmd instead of Ctrl. Single-key shortcuts (1-9, L, Space) are disabled while typing in input fields, but modifier-based shortcuts (Ctrl/Cmd + key) remain active.
Next Steps
- Quick Start Guide - Start exploring your data
- Map Viewer - Learn about the map viewer in detail