Appearance
DEG Analysis
InSilicoLab Feature
This feature is exclusive to Portrai InSilicoLab.
Differential Expression Gene (DEG) analysis identifies genes that show statistically significant differences in expression between cell populations. This is essential for understanding biological differences between tissue regions, cell types, or experimental conditions.
Overview
What is DEG Analysis?
DEG analysis compares gene expression levels between two or more groups of cells to find:
- Upregulated genes - Higher expression in the target group
- Downregulated genes - Lower expression in the target group
- Statistically significant differences - Accounting for biological and technical variation
When to Use DEG Analysis
- Comparing tumor cells vs. normal cells
- Identifying marker genes for cell types
- Finding spatially variable genes
- Comparing treatment vs. control conditions
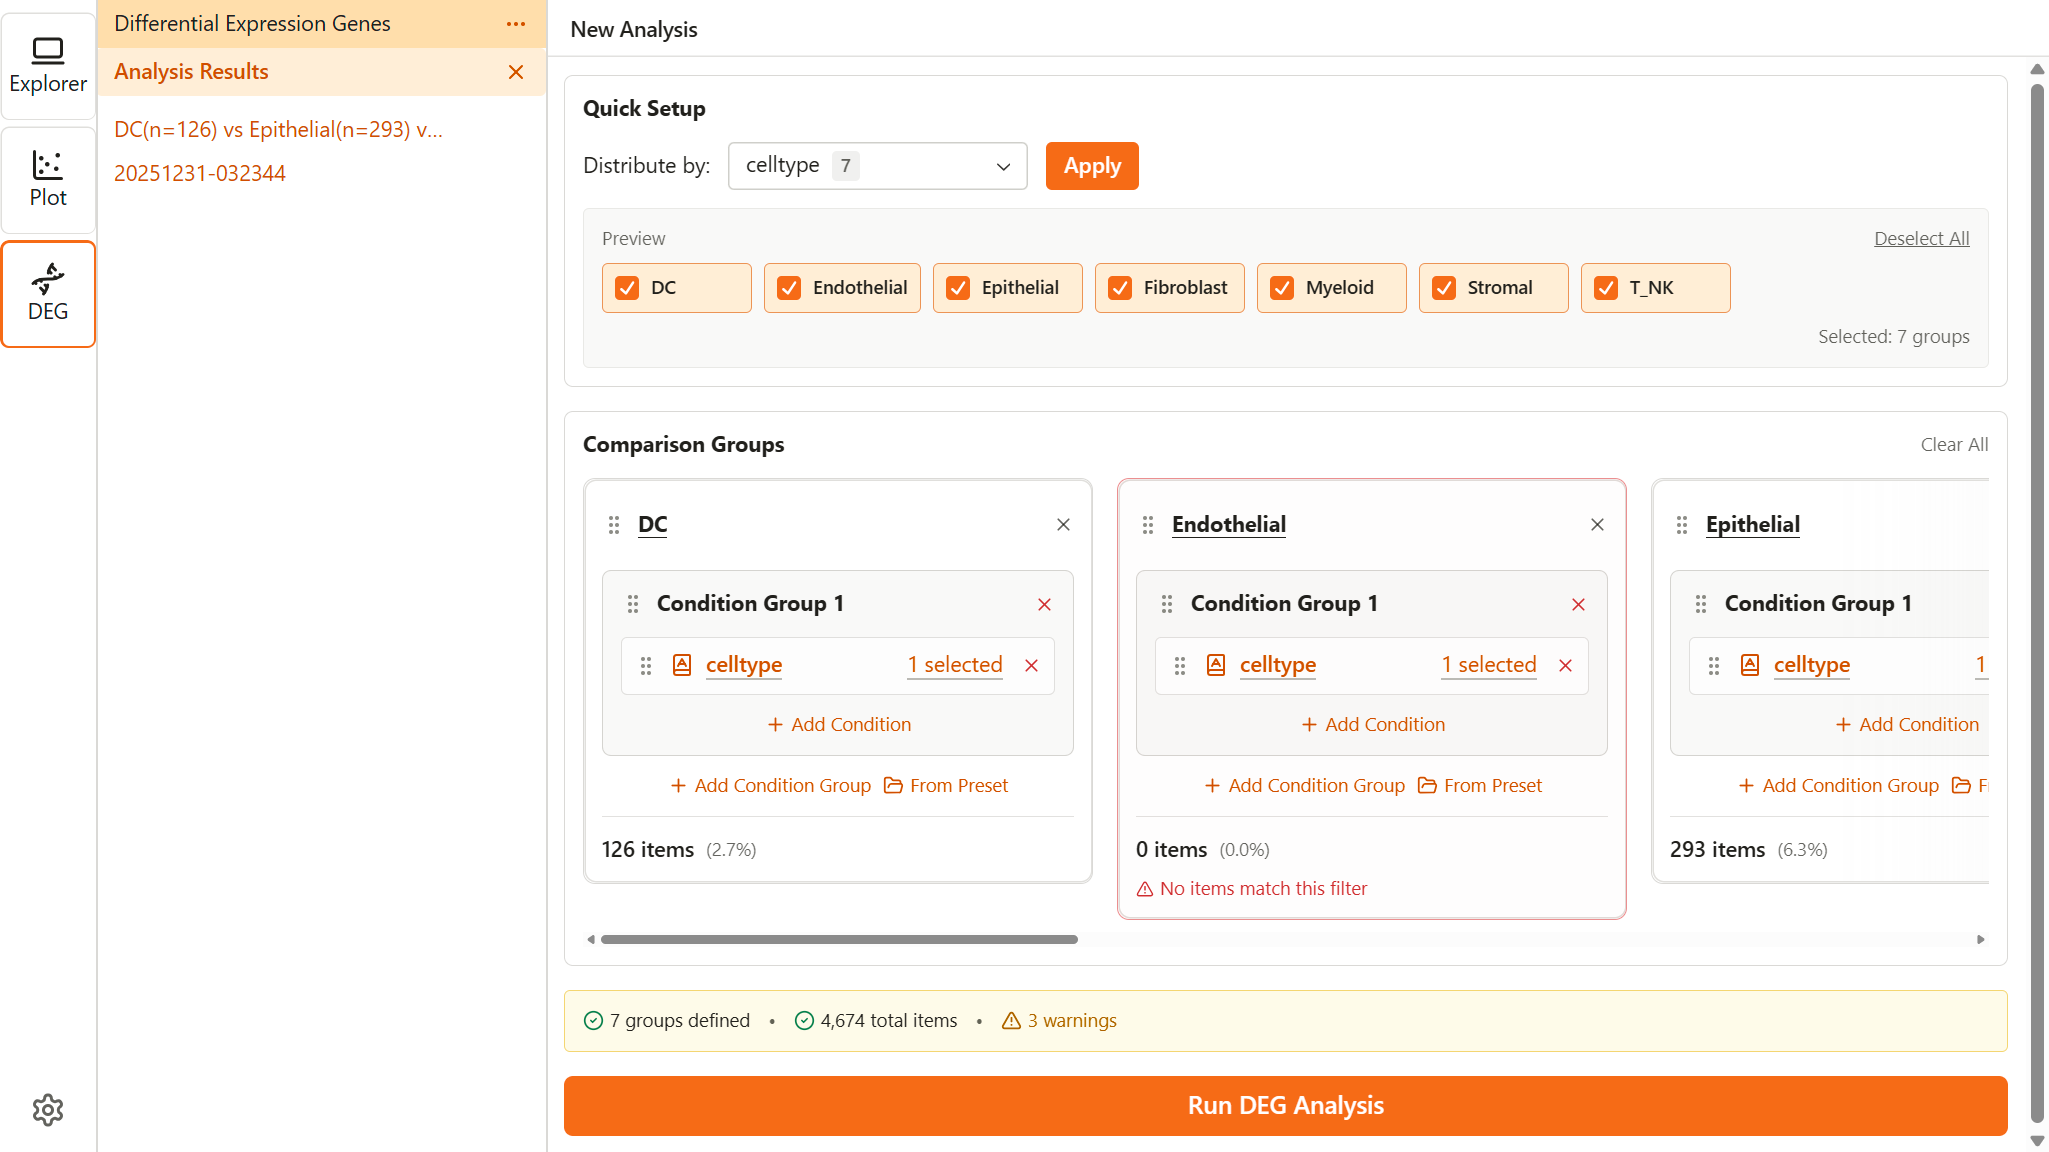
Opening DEG Analysis
- Click the DEG icon (DNA symbol) in the Activity Bar
- The DEG extension opens with:
- Sidebar - New Analysis button and list of previous results
- Workspace - New analysis form or selected result viewer
Setting Up Comparison Groups
DEG analysis requires defining at least two groups of cells to compare. Each group is defined using subset conditions.
Quick Setup
Quick Setup automatically creates groups based on a categorical feature.
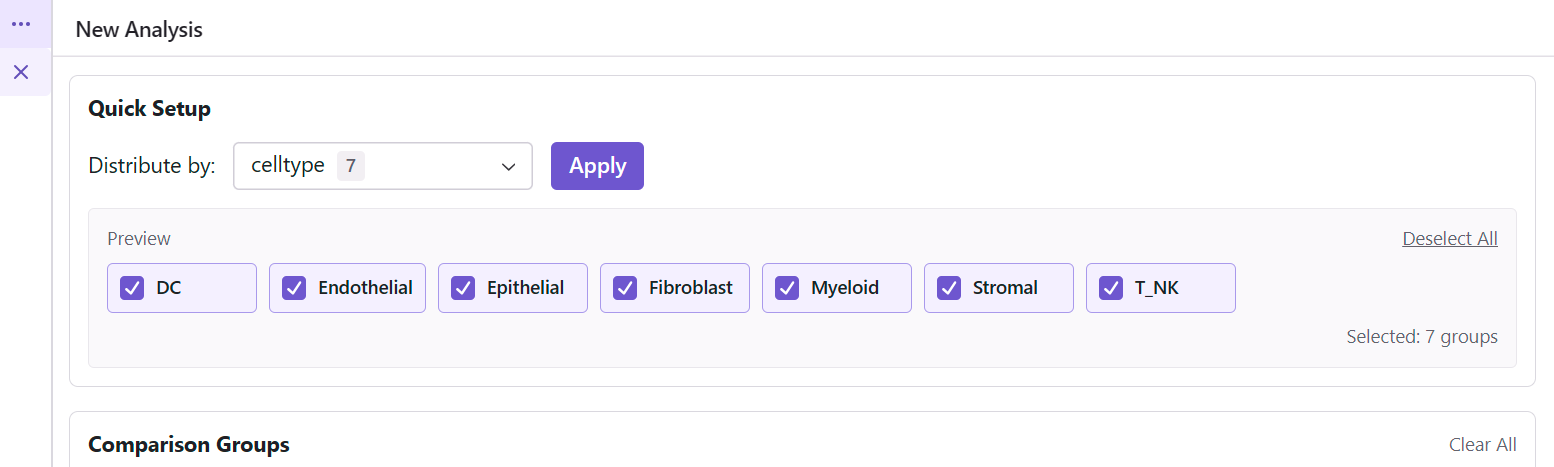
- In the Quick Setup section, select a categorical feature from the Distribute by dropdown (e.g., cell_type)
- A preview panel appears showing all available labels with checkboxes
- Select which labels to include as groups (use Select All / Deselect All for convenience)
- Click Apply to create groups (minimum 2 labels required)
- If existing groups are present, a confirmation dialog asks whether to replace them
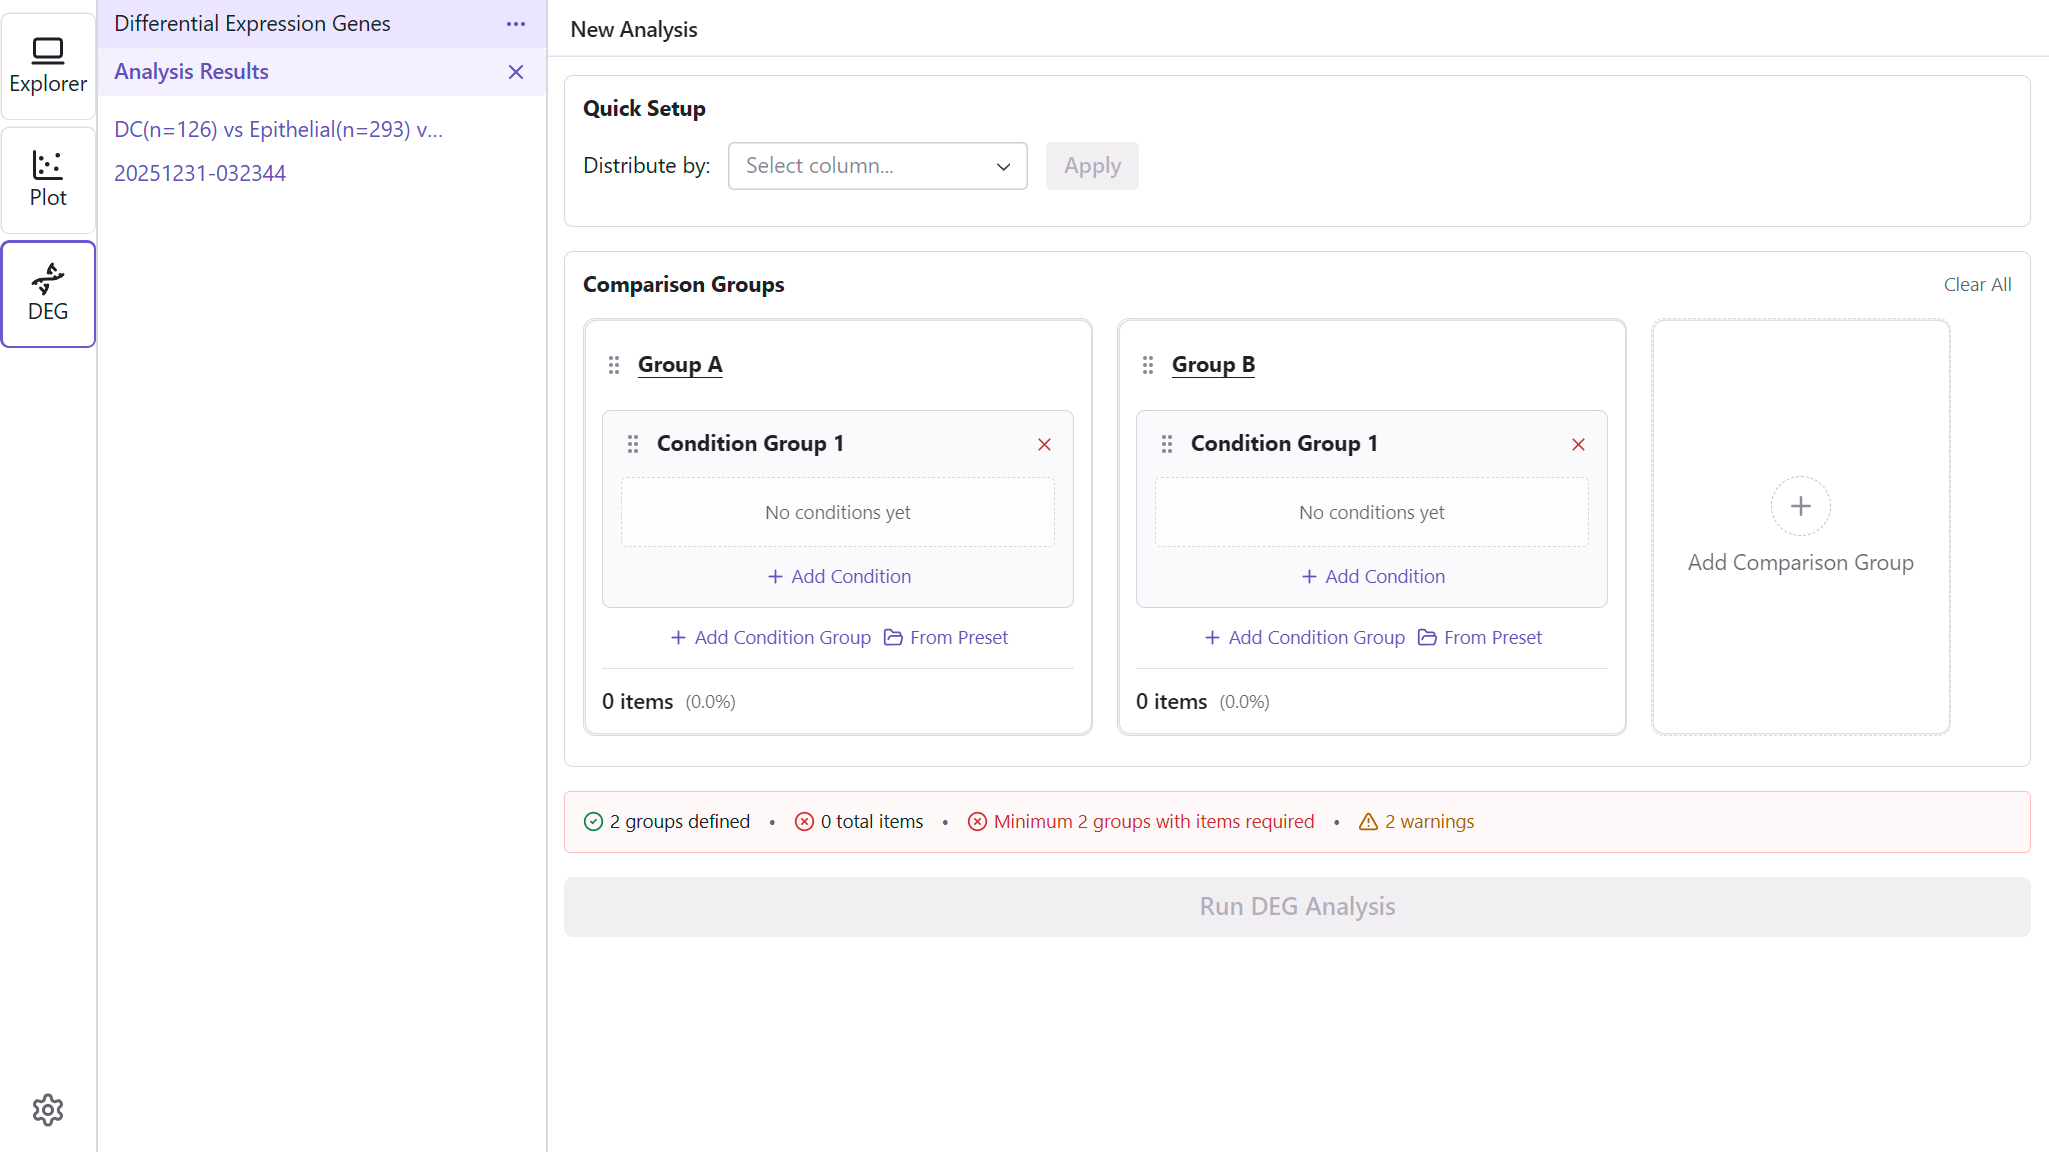
Manual Setup
For more control, manually configure each comparison group.
Adding Groups
- Click Add Group to create a new comparison group
- Groups are automatically named (Group A, Group B, etc.)
- Add at least 2 groups for comparison
Configuring Group Conditions
Each group uses the same condition system as the Subset:
- Click on a group card to expand it
- Add subset conditions:
- Column conditions - Select by feature values
- Lasso conditions - Select by spatial/embedding selection
- Signature conditions - Select by gene set scores
- Combine conditions with AND/OR operators
- View the item count to verify your selection
Renaming Groups
- Click on the group name
- Enter a descriptive name (e.g., "Tumor Core", "Stromal Border")
- Press Enter to save
Using Saved Subsets
Apply saved subsets to quickly configure groups:
- Open the group's condition editor
- Click Apply Saved Subset
- Each saved subset shows its name and a condition expression preview (hover for full expression)
- Select a saved subset
- The saved subset's conditions are applied to the group
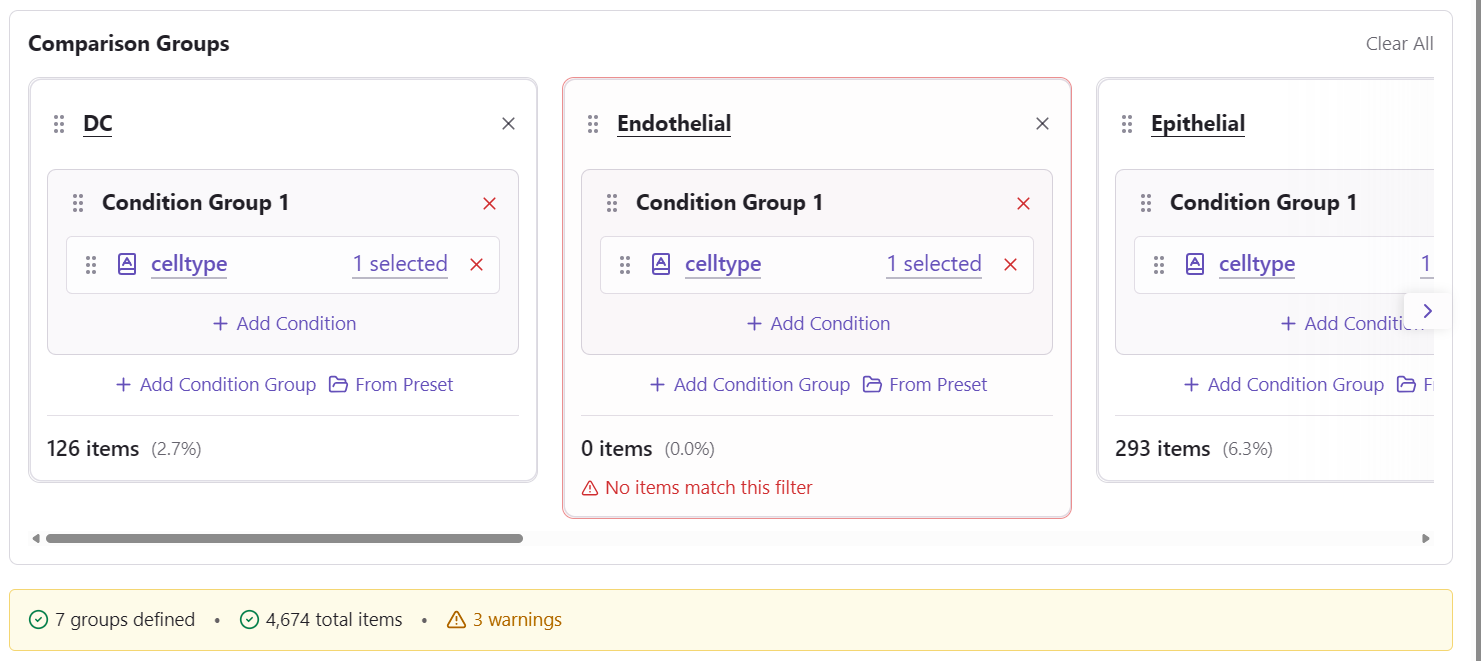
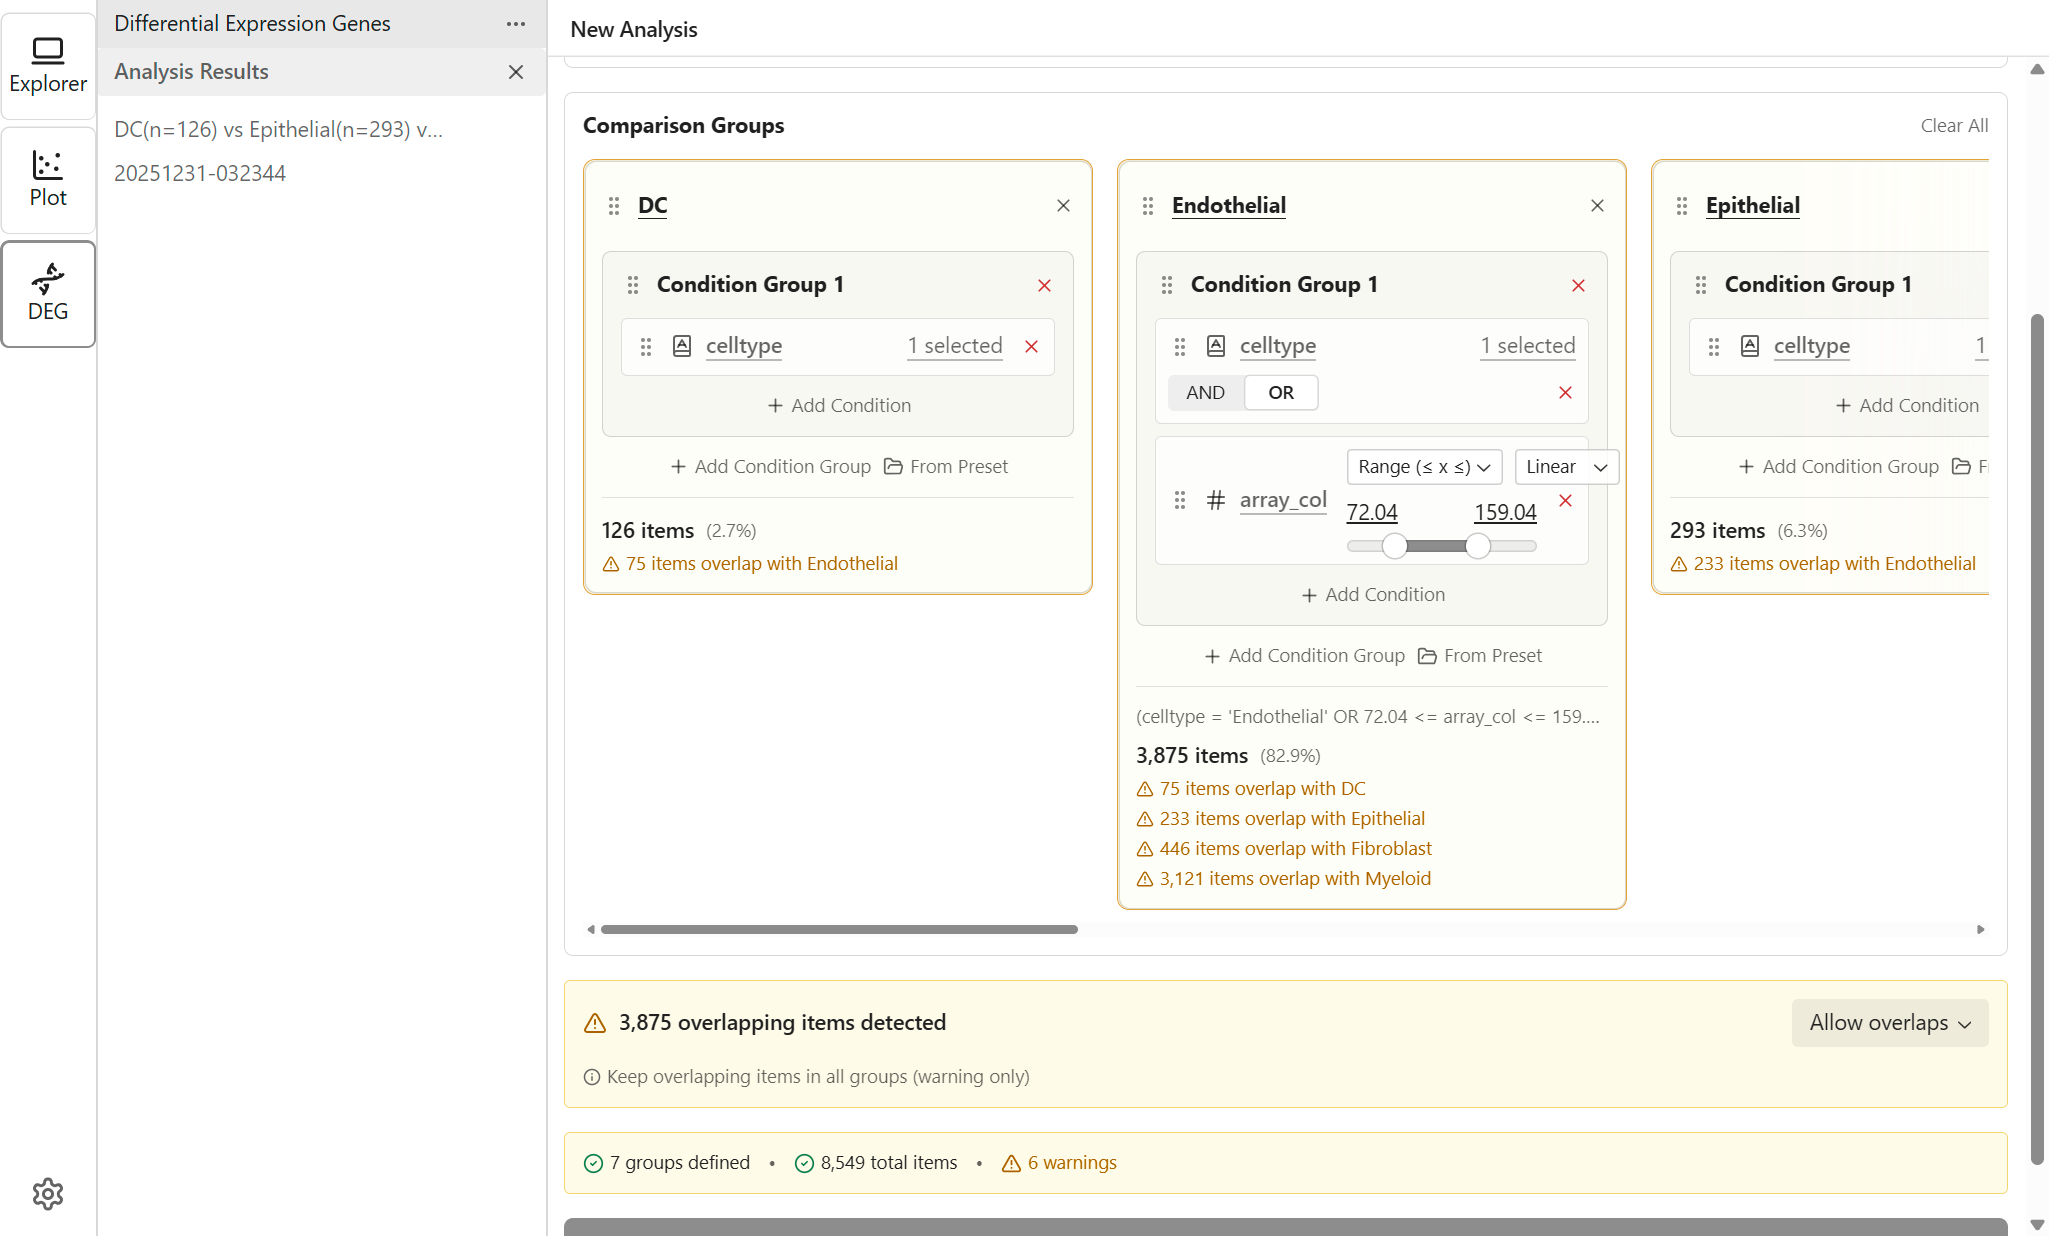
Handling Overlapping Items
When cells match multiple group criteria, you need to decide how to handle overlaps.
Overlap Statistics
The overlap handler shows:
- Number of overlapping items between each pair of groups
- Percentage of total items affected
- Adjusted item counts after applying the strategy
Overlap Strategies
| Strategy | Description | Best For |
|---|---|---|
| Exclude from all | Remove overlapping items from all groups (default) | Strictest separation |
| Allow overlaps | Keep items in all matching groups (warning only) | When overlap is intentional |
| Keep in first group | Keep in the first matching group only | Priority-based assignment |
| Keep in largest group | Keep in the group with most items | Statistical power |
Choosing a Strategy
- Allow overlaps - Use when groups intentionally share items (e.g., comparing overlapping phenotypes)
- Exclude from all - Use when you need completely distinct populations
- Keep in first group - Use when groups have a natural priority order
- Keep in largest group - Use to maximize statistical power in each group
Validation
Before running analysis, the system validates your configuration.
Requirements
- Minimum 2 groups - At least two groups are required for comparison
- Sufficient items - Groups with very few items may produce unreliable results
Handling Empty Groups
When using Quick Setup, some categories may result in groups with no items (e.g., if certain cell types are absent from the current subset). Empty groups are shown as warnings rather than errors.
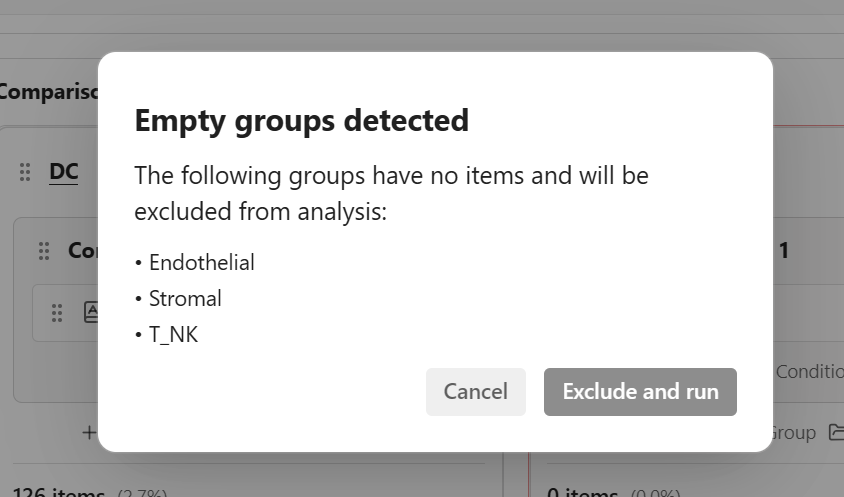
When you attempt to run analysis with empty groups:
- A confirmation dialog appears listing the empty groups
- You can choose to Exclude empty groups and continue - The analysis proceeds without the empty groups
- Or Cancel - Return to adjust your group configuration
TIP
Empty groups are automatically excluded from the analysis. You don't need to manually remove them if you choose to continue.
Validation Messages
| Type | Meaning |
|---|---|
| Error | Must be fixed before analysis can run |
| Warning | Analysis can run, but results may be affected (e.g., empty groups) |
Running Analysis
- Verify all groups are configured correctly
- Check the validation summary for errors
- Click Run DEG Analysis
- The analysis is submitted to the server
- Progress is shown in the Sidebar
Analysis Duration
Analysis time depends on:
- Number of cells in each group
- Number of groups being compared
- Server load
You can navigate away and return later - results are saved.
Understanding Results
Results List
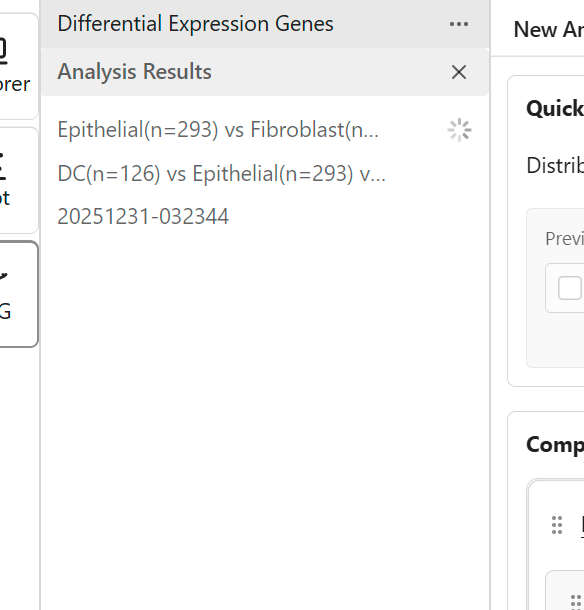
Previous analysis results appear in the Sidebar:
- Click a result to view it
- Results show a progress indicator while processing
- Completed results can be reopened anytime
Result View Layout
When you open a completed result, the workspace displays a tabbed visualization pane (Heatmap or Volcano Plot) in the top half and the Data Table in the bottom half:
┌─────────────────────────────────────┐
│  [Heatmap] [Volcano Plot]   (tabs) │
│       Active visualization         │
│   (Heatmap or Volcano Plot)        │
├═══════════════ divider ═════════════│
│       Data Table (bottom pane)      │
│   Detailed statistics per gene      │
└─────────────────────────────────────┘- Tabs - Switch between Heatmap and Volcano Plot using the tab bar at the top of the visualization pane
- Resizable divider - Drag the horizontal divider between the two panes to adjust the height ratio (default is 50/50)
- Shared thresholds - The Log2FC and FDR thresholds are shared between the Heatmap and Volcano Plot views; changing thresholds in one view applies to the other
- Cross-component selection - Genes selected via lasso in the Volcano Plot or via checkboxes in the Data Table are synchronized bidirectionally
- Both the active visualization and the Data Table are always visible simultaneously
Heatmap View
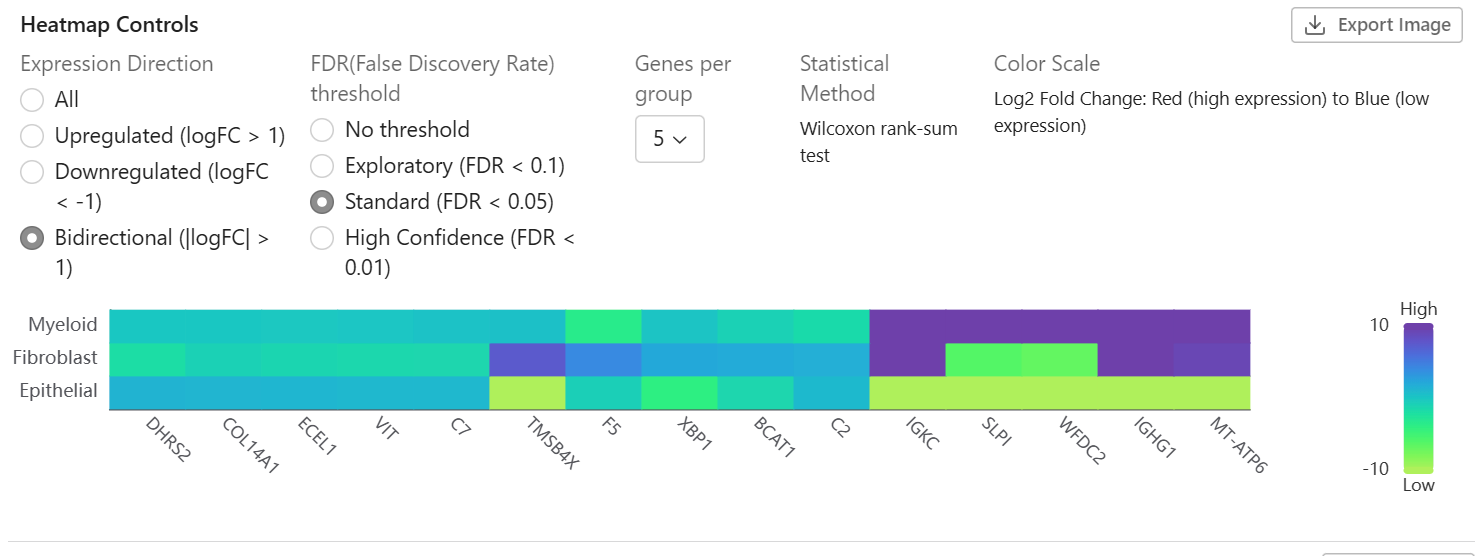
The heatmap shows expression patterns across groups:
- Rows - Genes (filtered by significance)
- Columns - Comparison groups
- Colors - Expression level (log fold change)
- Clustering - Similar genes are grouped together
- Statistical Method - Displays the test used (e.g., "Wilcoxon rank-sum test")
Statistical Method
The heatmap configuration panel displays the statistical method used for differential expression testing:
| Method | Description |
|---|---|
| Wilcoxon rank-sum test | Non-parametric test comparing distributions between groups |
This information helps ensure reproducibility and proper interpretation of results.
Display Metric
Choose which statistical measure to visualize in the heatmap:
| Metric | Description | Color Scale | Use Case |
|---|---|---|---|
| Log2 Fold Change (default) | Expression ratio between groups | Red-Blue (diverging) | Shows expression direction |
| Score (Z-score) | Statistical test score | Red-Blue (diverging) | Compare relative significance |
| Adjusted P-value | FDR-corrected significance | Yellow-Red (sequential) | Focus on statistical significance |
Genes per Group
Control how many top genes are displayed per group in the heatmap:
| Option | Description |
|---|---|
| 5 | Show top 5 genes per group (default) |
| 10 | Show top 10 genes per group |
| 20 | Show top 20 genes per group |
| 50 | Show top 50 genes per group |
Genes are ranked by the selected display metric after applying direction and FDR filters, then the top N genes from each group are shown. Increasing this value shows more genes but may make the heatmap harder to read.
TIP
The selected gene count is reflected in the exported filename (e.g., Top10 in the filename indicates 10 genes per group were displayed).
Axis Swap
Toggle the Swap Axes switch at the bottom of the heatmap to transpose the orientation:
- Default: Genes on X-axis, groups on Y-axis
- Swapped: Groups on X-axis, genes on Y-axis
This is useful when you have many groups and want to see them spread horizontally, or when gene labels are easier to read on a specific axis.
Y-Axis Order
Groups are displayed on the Y-axis in the order they were defined, with the first selected group on top. This ensures the visual order matches your group definition order.
Reading the Heatmap
The color interpretation depends on the selected metric:
For Log2 Fold Change and Score:
- Red/warm colors - Higher expression (upregulated) or positive score
- Blue/cool colors - Lower expression (downregulated) or negative score
- Intensity - Magnitude of difference
For Adjusted P-value:
- Dark colors - More statistically significant (lower p-value)
- Light colors - Less statistically significant (higher p-value)
Volcano Plot
The Volcano Plot visualizes the relationship between fold change magnitude (X-axis) and statistical significance (Y-axis) for each gene, making it easy to identify genes that are both statistically significant and biologically meaningful.
View Modes
The Volcano Plot offers two viewing modes, selectable via a toggle in the toolbar:
| Mode | Description | Best For |
|---|---|---|
| Single | Displays one comparison group at a time with a group selector | Detailed exploration of a single group |
| Grid | Displays all groups simultaneously in a responsive grid | Quick comparison across all groups |
Single View:
- Select a comparison group from the Group dropdown
- Full interactive toolbox available (Pan, Lasso Selection, Reset View)
Grid View:
- All comparison groups are shown simultaneously in a responsive grid (columns adjust to container width)
- Each cell displays the group name and a subtitle showing "Up: N Down: N" gene counts
- Click any cell (title or data points) to switch to Single View for that group
- Mouse wheel zoom is available within each cell
Toolbar Controls
| Control | Location | Description |
|---|---|---|
| View Mode toggle | Left | Switch between Single and Grid view |
| Group selector | Left | Select comparison group (Single View only) |
| Y-Axis Metric | Left | Choose the Y-axis statistical measure |
| Thresholds | Left | Configure Log2FC and FDR threshold values |
| Gene Labels | Left | Toggle gene name labels for significant genes |
| Export Image | Right | Export chart as PNG (Single View only) |
Y-Axis Metric
Choose which statistical measure to display on the Y-axis:
| Metric | Description |
|---|---|
| -log10(Adjusted P-value) (default) | FDR-corrected significance, more conservative |
| -log10(P-value) | Raw significance, less conservative |
Higher values on the Y-axis indicate greater statistical significance.
Thresholds
Click the Thresholds button to open a popover with two settings:
- Log2FC Threshold - Minimum fold change cutoff (default: 1, equivalent to 2-fold change). Genes beyond ±threshold that pass the FDR cutoff are classified as significant.
- FDR Threshold - Select from: No threshold, 0.1, 0.05, 0.01.
Threshold lines are displayed on the chart as dashed lines:
- Vertical lines at ±Log2FC threshold
- Horizontal line at the FDR threshold (in -log10 scale)
TIP
Threshold values are shared with the Heatmap view. Changing the Log2FC or FDR threshold in the Volcano Plot also updates the Heatmap, and vice versa.
Gene Labels
Click the Gene Labels button to toggle gene name labels:
- Labels are shown for all significant (upregulated and downregulated) genes
- Labels are positioned to the right for upregulated genes (positive logFC) and to the left for downregulated genes (negative logFC)
- Overlapping labels are automatically hidden to maintain readability
Color Coding
| Category | Color | Criteria |
|---|---|---|
| Upregulated | Red | logFC > threshold AND adjusted p-value < FDR threshold |
| Downregulated | Blue | logFC < -threshold AND adjusted p-value < FDR threshold |
| Not Significant | Gray | Does not meet both fold change and significance cutoffs |
Chart Interactions (Single View)
The chart toolbox (top-right corner) provides:
| Tool | Icon | Description |
|---|---|---|
| Pan | Hand | Drag to pan the chart view |
| Lasso Selection | Lasso | Draw a polygon to select genes within the area |
| Reset View | Crosshair | Reset zoom and pan to the initial state |
Additional interactions:
- Mouse wheel zoom on both X and Y axes
- Hover tooltip showing gene name, group, Log2 Fold Change, Adjusted P-value, and direction
- Legend - Click to toggle category visibility; hover to highlight
Cross-component Selection
The Volcano Plot and Data Table share a bidirectional gene selection:
- Volcano to Table - Use Lasso Selection to draw a polygon around genes. Selected genes are automatically checked in the Data Table.
- Table to Volcano - Select genes via checkboxes in the Data Table. Corresponding points are highlighted in the Volcano Plot.
Selected genes from either source can be used to Create Signature via the Data Table toolbar.
TIP
Lasso selection is only available in Single View mode.
Data Table
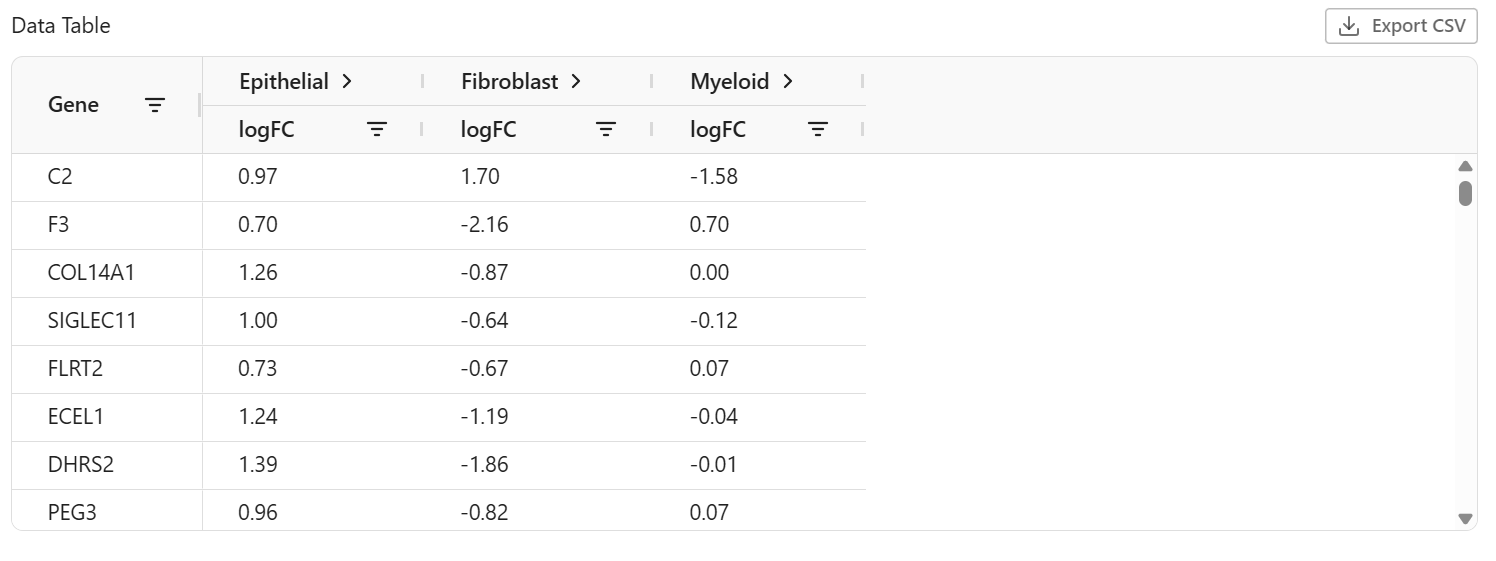
The data table provides detailed statistics for each gene:
| Column | Description |
|---|---|
| Gene Name | Gene symbol or identifier |
| Score | Statistical test score |
| Log Fold Change | log2(Group B / Group A) expression ratio |
| P-value | Raw statistical significance |
| Adjusted P-value (FDR) | Multiple testing corrected p-value |
Column Groups
Columns for each comparison group can be expanded or collapsed:
- Click the Expand Columns / Collapse Columns button in the table toolbar to toggle all groups
- You can also manually expand or collapse individual column groups by clicking the group header
- Default: All column groups are expanded
When expanded, each group shows: Log Fold Change, Adjusted P-value, and Score columns. When collapsed, only Log Fold Change is visible.
Sorting Results
- Click column headers to sort
- Click again to reverse sort order
- Sort by adjusted p-value to find most significant genes
Selection and Cross-component Sync
Select genes using the row checkboxes. Selections are synchronized with the Volcano Plot:
- Genes selected in the Data Table are highlighted in the Volcano Plot
- Genes selected via Lasso in the Volcano Plot are automatically checked in the Data Table
- The selection count is displayed next to the "Data Table" heading
Create Signature from Results
After reviewing DEG results, you can create a Signature directly from selected genes for downstream analysis.
- In the Data Table, select genes using the row checkboxes
- Click the Create Signature button in the table toolbar (enabled when 1+ genes are selected)
- In the dialog, enter:
- Name (required) - e.g., "DEG Upregulated Genes"
- Description (optional) - Additional context
- A preview of selected genes is shown (up to 50, with "+X more" for larger selections)
- Click Create Signature
- A success notification confirms creation
The new Signature appears immediately in the Explorer's Signatures tab and can be used for color mapping, subsetting, or scatter plot axes.
Filtering Results
FDR Threshold
Filter genes by statistical significance using False Discovery Rate (FDR):
| Level | Threshold | Description |
|---|---|---|
| No threshold | All | Show all genes |
| Exploratory | FDR < 0.1 | Lenient, for initial exploration |
| Standard | FDR < 0.05 | Commonly used significance level |
| High Confidence | FDR < 0.01 | Strict, high confidence results |
Choosing a Threshold
- Start with No threshold to see overall patterns
- Use Standard (0.05) for publishable results
- Use High Confidence (0.01) for validation candidates
TIP
The FDR threshold is shared between the Heatmap and Volcano Plot views. Changing the threshold in one view also updates the other. The Data Table maintains its own independent filter.
Direction Filter
Filter genes by expression change direction with a configurable logFC threshold:
| Filter | Criteria | Shows |
|---|---|---|
| All | - | All differentially expressed genes |
| Upregulated | logFC > threshold | Genes with higher expression in target |
| Downregulated | logFC < -threshold | Genes with lower expression in target |
| Bidirectional | |logFC| > threshold | Strongly changed in either direction |
LogFC Threshold
The logFC threshold determines the minimum fold change required for direction filtering. The default value is 1 (equivalent to a 2-fold change).
- When selecting a direction filter (Upregulated, Downregulated, or Bidirectional), an inline input field appears within the selected option
- Adjust the threshold value to make filtering more or less strict
- Changes apply immediately in the heatmap view
TIP
A logFC threshold of 1 means 2-fold change, 2 means 4-fold change, and 0.5 means ~1.4-fold change. Adjust based on the magnitude of expression differences in your data.
TIP
The logFC threshold is shared between the Heatmap and Volcano Plot views, where it controls the vertical threshold lines at ±logFC. The Data Table maintains its own independent threshold.
Interpreting Direction
- Upregulated (logFC > threshold) - Higher expression in target group
- Downregulated (logFC < -threshold) - Lower expression in target group
- Bidirectional - Strongly changed regardless of direction
Exporting Results
Heatmap Image Export
Capture the heatmap as a PNG image with configurable dimensions:
- Open a completed DEG analysis result
- Click the Export Image button
- A popover appears with dimension settings:
- Width - Export width in pixels (default: 1200, max: 10000)
- Height - Export height in pixels (default: 800, max: 10000)
- Click Download to export
The exported image includes:
- Heatmap with expression colors
- Gene names and group names on axes
- Color scale legend
- Current filter settings applied
File naming format: DEG_Heatmap_{date}_{metric}_{direction}_FDR_{threshold}_Top{n}.png
TIP
When axis swap is enabled, the filename includes a "_Transposed" suffix.
See Image Export for more details.
Volcano Plot Image Export
Capture the Volcano Plot as a PNG image with configurable dimensions (Single View only):
- Switch to Single View and select the desired comparison group
- Click the Export Image button in the toolbar (right side)
- A popover appears with dimension settings:
- Width - Export width in pixels (default: 1200, max: 10000)
- Height - Export height in pixels (default: 800, max: 10000)
- Click Download to export
The exported image includes:
- Scatter plot with color-coded gene points
- Threshold lines (logFC and FDR)
- Legend (Upregulated, Downregulated, Not Significant)
- Gene labels (if enabled)
- Current Y-axis metric and threshold settings
File naming format: DEG_Volcano_{date}_{group}_{yAxisMetric}.png
TIP
Image export is only available in Single View mode. Grid View does not support image export.
Data Table CSV Export
Export the full DEG results as a CSV file:
- Open a completed DEG analysis result
- In the Data Table section, click Export CSV
- The file downloads as
deg_results.csv
The exported CSV includes for each gene:
- Gene name
- For each comparison group:
- Log fold change (logFC)
- Adjusted P-value
- Score
Best Practices
Group Definition
- Use meaningful groups - Define groups based on biological questions
- Ensure sufficient size - Aim for at least 50-100 cells per group
- Check for overlaps - Review overlap statistics before analysis
- Name groups clearly - Use descriptive names for documentation
Result Interpretation
- Start broad, then filter - Begin with no thresholds, then apply filters
- Check multiple genes - Don't rely on single gene results
- Validate biologically - Confirm results make biological sense
- Document your analysis - Record group definitions and parameters
Common Pitfalls
| Issue | Solution |
|---|---|
| Too few significant genes | Relax FDR threshold or check group definitions |
| Too many significant genes | Use stricter FDR threshold or direction filter |
| Unexpected results | Verify group definitions match your hypothesis |
| Analysis fails | Check that groups have sufficient, non-overlapping items |
Troubleshooting
Analysis Won't Start
- Check validation summary for errors
- Ensure at least 2 groups are defined
- Verify each group has items selected
No Results After Analysis
- The analysis may still be processing (check progress)
- Try refreshing the results list
- Results expire after some time - rerun if needed
Unexpected Gene Rankings
- Verify group definitions are correct
- Check for overlapping items affecting statistics
- Consider the overlap handling strategy used
Related Topics
- Image Export - Export heatmap or volcano plot as PNG
- Subset - Subset conditions for group definition
- Lasso Selection - Spatial selection for groups
- Signatures - Gene sets for analysis