Appearance
Features
Core Feature
This feature is available in all Portrai Explorer deployments.
Features are data columns that describe properties of each data point (cell or spot) in your dataset. Portrai Explorer uses features for color mapping, subsetting, and analysis.
Feature Types
Portrai Explorer supports two types of features:
Categorical Features
Categorical features contain discrete labels that group data points into categories.
Examples:
- Cell type (e.g., "B cell", "T cell", "Macrophage")
- Cluster assignments (e.g., "Cluster 0", "Cluster 1")
- Sample ID
- Treatment group
Characteristics:
- Finite set of distinct labels
- Each point belongs to exactly one category
- Displayed with distinct colors per category
Continuous Features
Continuous features contain numeric values that vary across data points.
Examples:
- Gene expression levels (e.g., "CD3E", "MS4A1")
- Quality metrics (e.g., "n_genes", "total_counts")
- Computed scores
Characteristics:
- Numeric values with a range (min to max)
- Displayed with a color gradient
- Can be subset by value range
Browsing Features
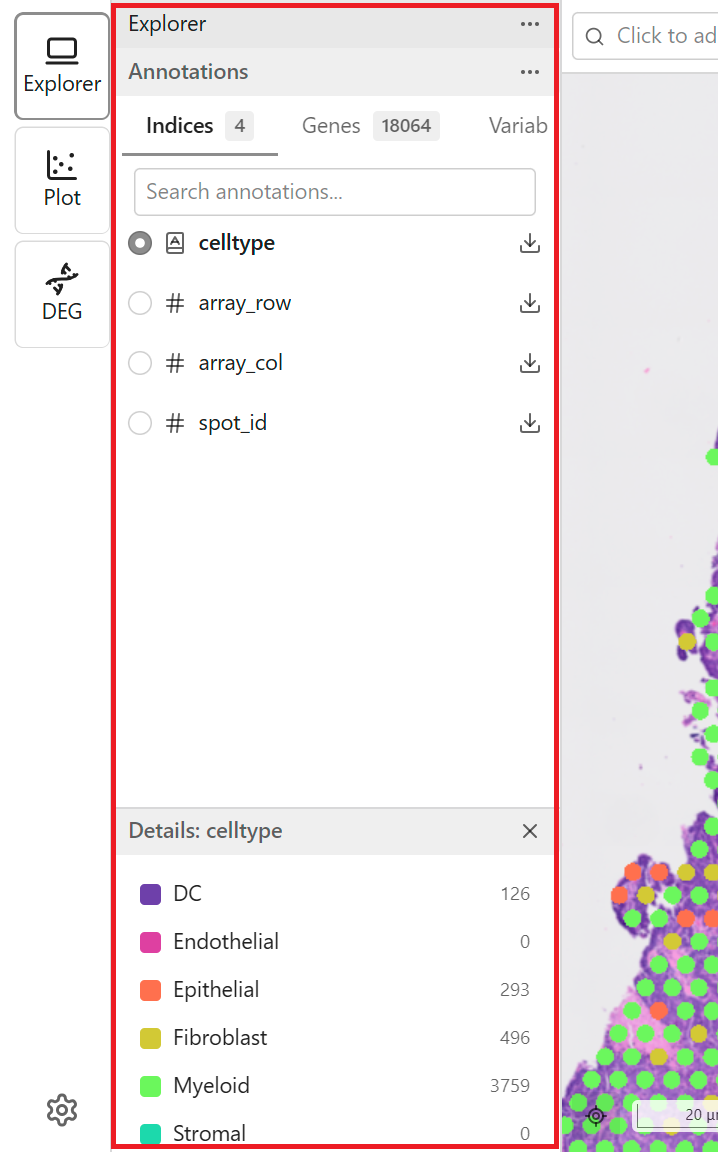
Sidebar Feature List
Access features through the Explorer sidebar:
- Tab Bar - Switch between Categorical and Continuous
- Search Field - Search features by name
- Feature List - Scrollable list of available features
- Detail Panel - Shows information about the selected feature
Sorting the Feature List
Use the Sort button to organize features alphabetically for easier navigation.
- Click the Sort button (↕ icon) next to the search field
- Choose a sorting option:
| Option | Description |
|---|---|
| Default | Original order from the dataset |
| Name A-Z | Alphabetical order (ascending) |
| Name Z-A | Reverse alphabetical order (descending) |
- The feature list reorders immediately
TIP
Sorting is applied globally across both Categorical and Continuous tabs. Your sort preference persists across sessions.
Switching Tabs
Click the tab labels to view different feature types:
| Tab | Contents |
|---|---|
| Categorical | Cell types, clusters, discrete labels |
| Continuous | Gene expression, numeric values |
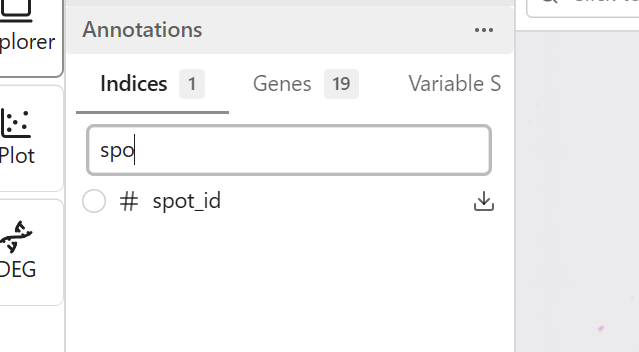
Searching Features
Use the search field to quickly find features:
- Click the search field at the top of the feature list
- Type part of the feature name
- The list filters to show matching features
- Clear the search to show all features
Selecting Features
For Color Mapping
Click a feature name to apply it as the color mapping:
- Browse or search for the desired feature
- Click the feature name
- The map updates to show points colored by that feature
- The legend updates to show the color scale
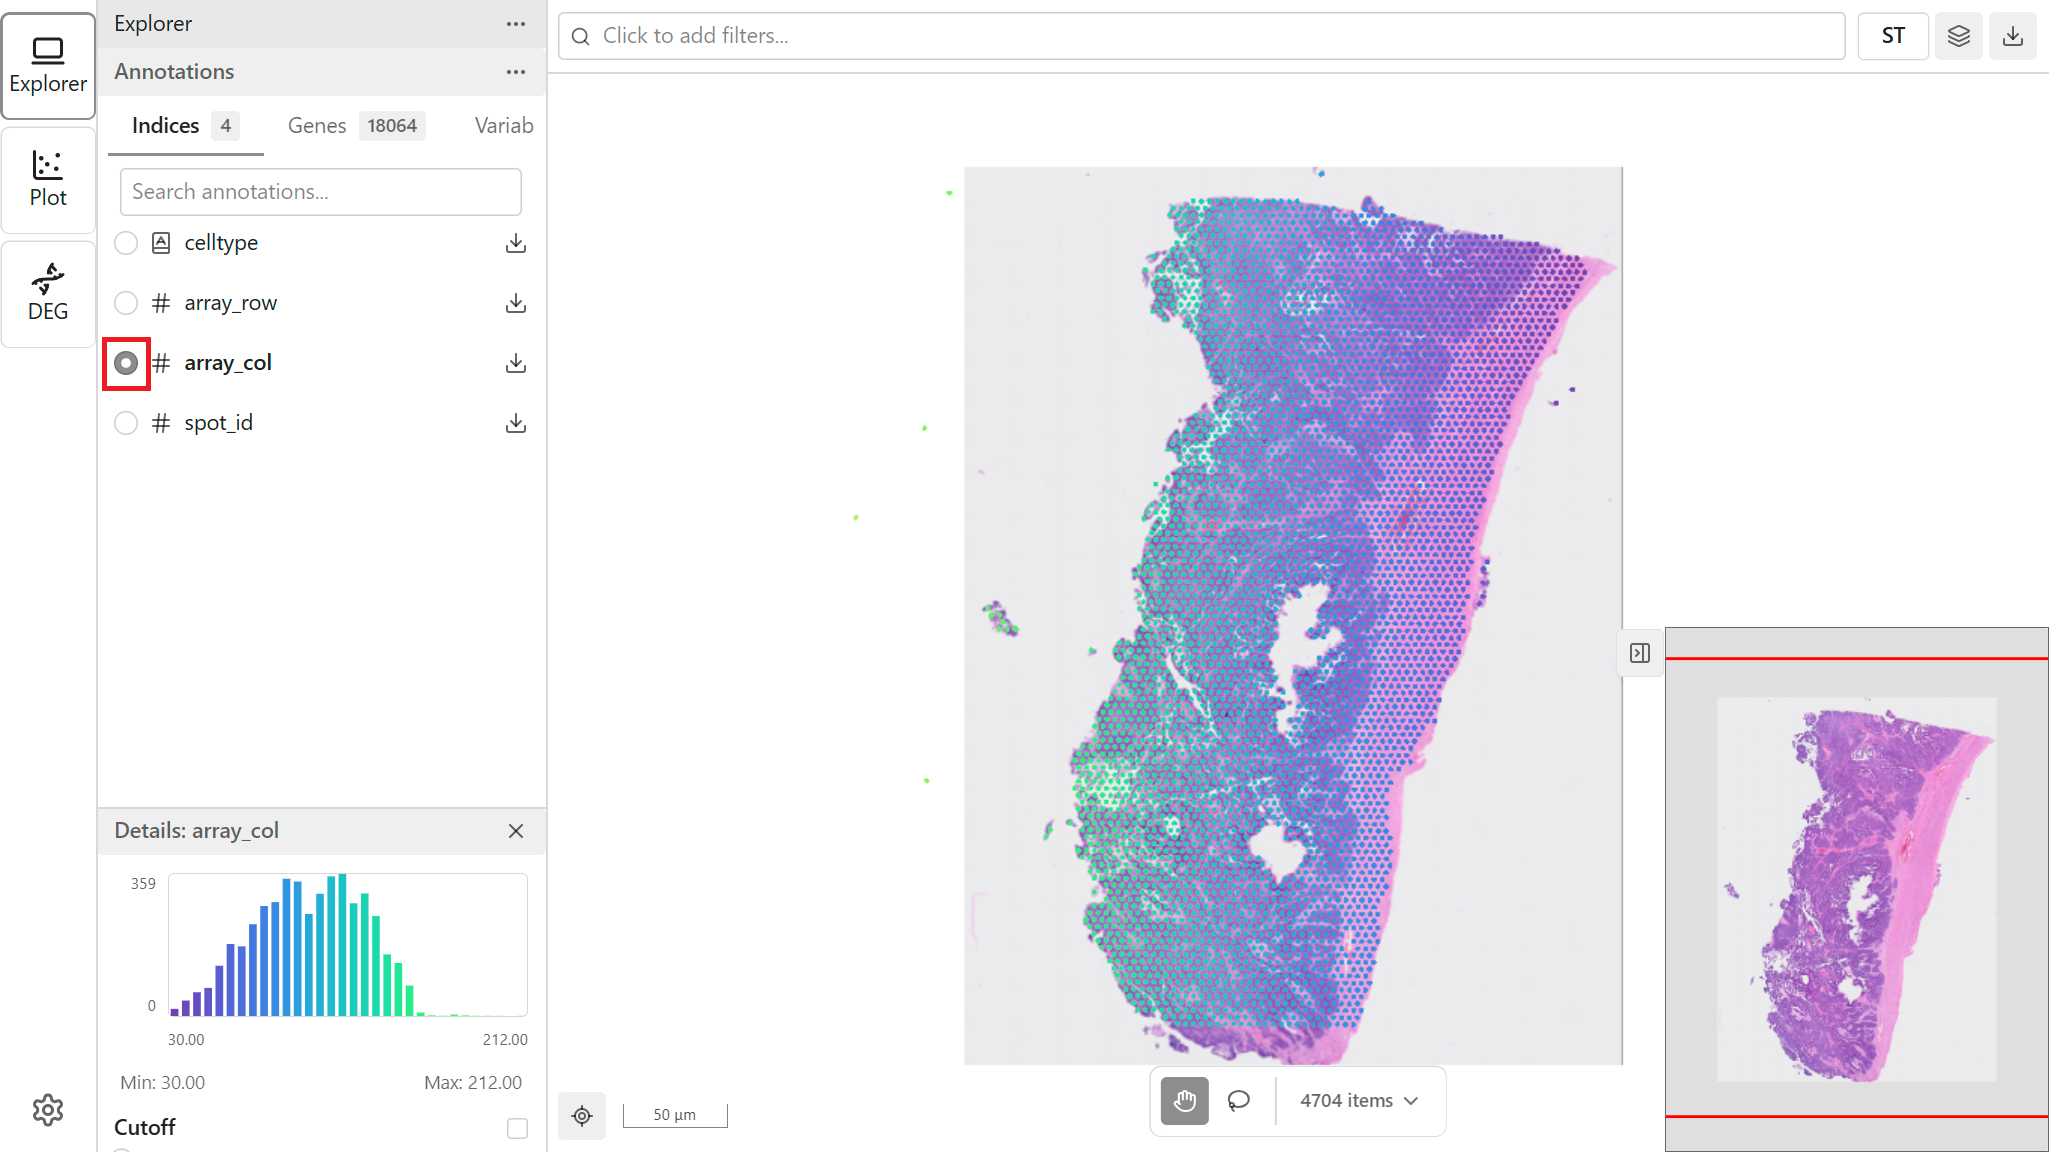
Viewing Details
When you select a feature, the Detail Panel shows additional information:
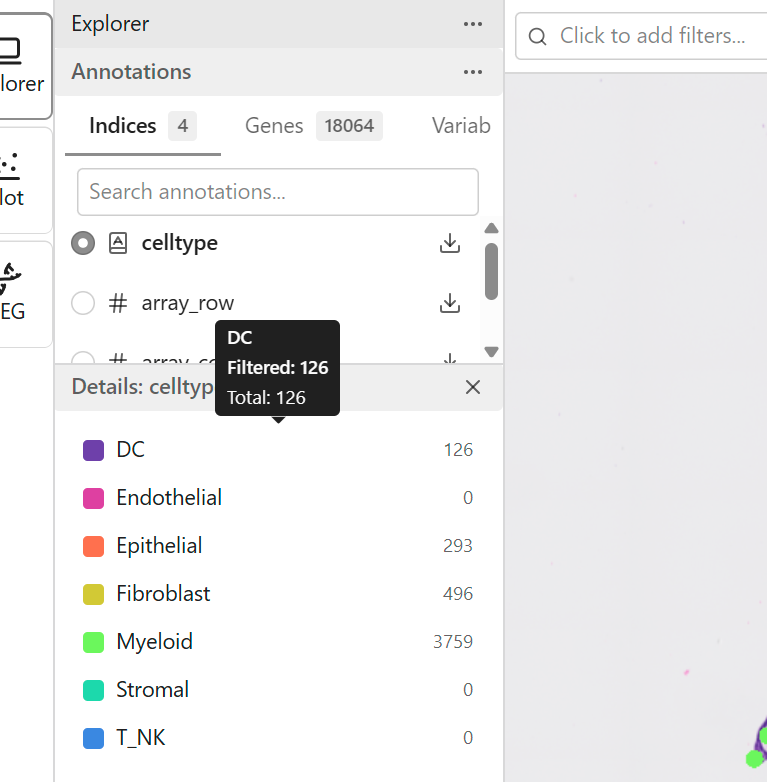
For Categorical:
- Category names and counts
- Color for each category (click to customize - see Customizing Category Colors)
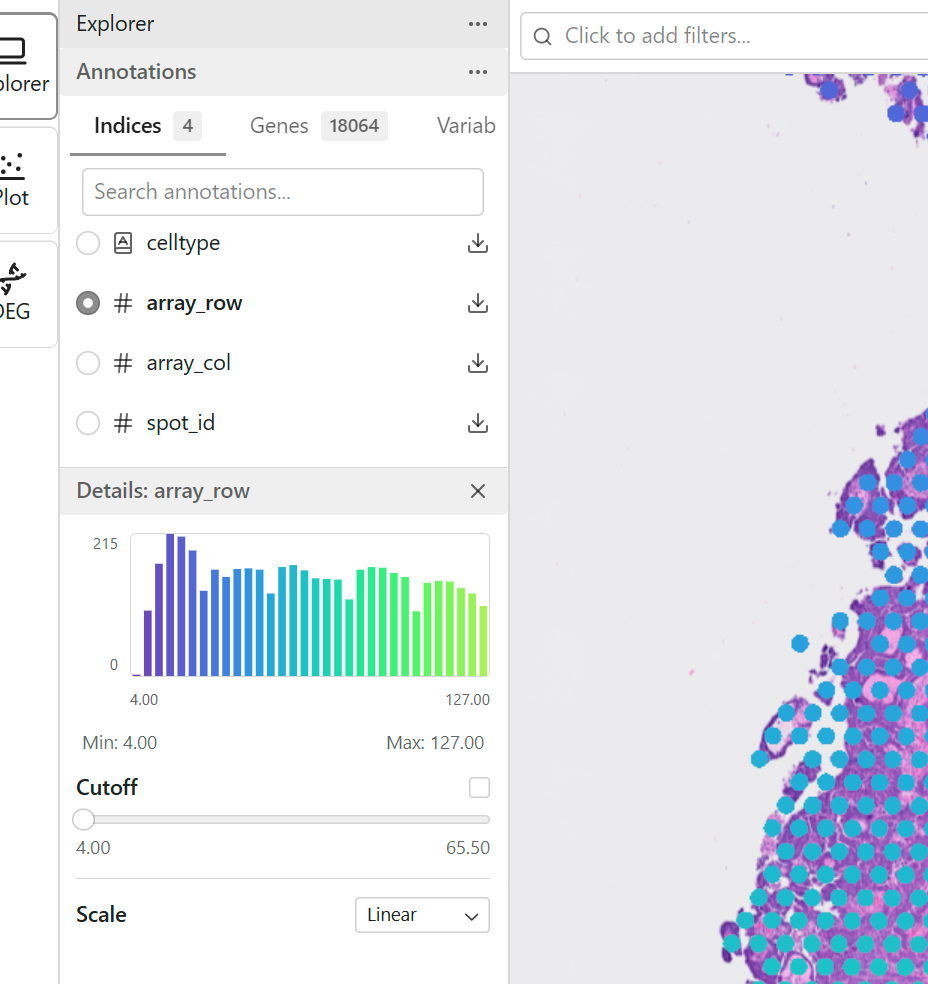
For Continuous:
- Minimum and maximum values
- Distribution information
Hidden Features
Some features may be hidden by default (e.g., internal columns, metadata). To show hidden features:
- Look for a "Show hidden" toggle or option
- Enable it to reveal hidden columns
- Hidden features appear in the list with a visual indicator
Feature States
Features can be in different loading states:
| State | Description |
|---|---|
| Idle | Not yet loaded |
| Loading | Currently fetching data |
| Ready | Fully loaded and available |
| Error | Failed to load |
Wait for features to reach "Ready" state before using them for visualization or subsetting.
Read-only Features
Some features are marked as read-only:
- Generated by the analysis pipeline
- Cannot be modified through the interface
- Protected from accidental changes
Read-only features can still be used for color mapping and subsetting.
Exporting Feature Data
Export feature data for use in other tools:
- Select the feature you want to export
- Look for an export or download option
- Choose CSV format
- The file downloads with point indices and values
See CSV Export for detailed export options.
Tips for Working with Features
- Start with categorical - Begin exploration with cell type or cluster features for clear groupings
- Use search - With many genes, search is faster than scrolling
- Check the legend - Understand what colors represent before interpreting patterns
- Combine with subsets - Use features both for color and subsetting simultaneously
Related Topics
- Color Mapping - Detailed color configuration
- Signatures - Create custom gene groups
- Subset - Subset by feature values